
主要ポイント
- Bitcoin is trading at $80,748 following a session that printed an intraday high of $82,361 before pulling back 1.76%, with the $80,000 level continuing to act as the dominant battleground between bulls and bears.
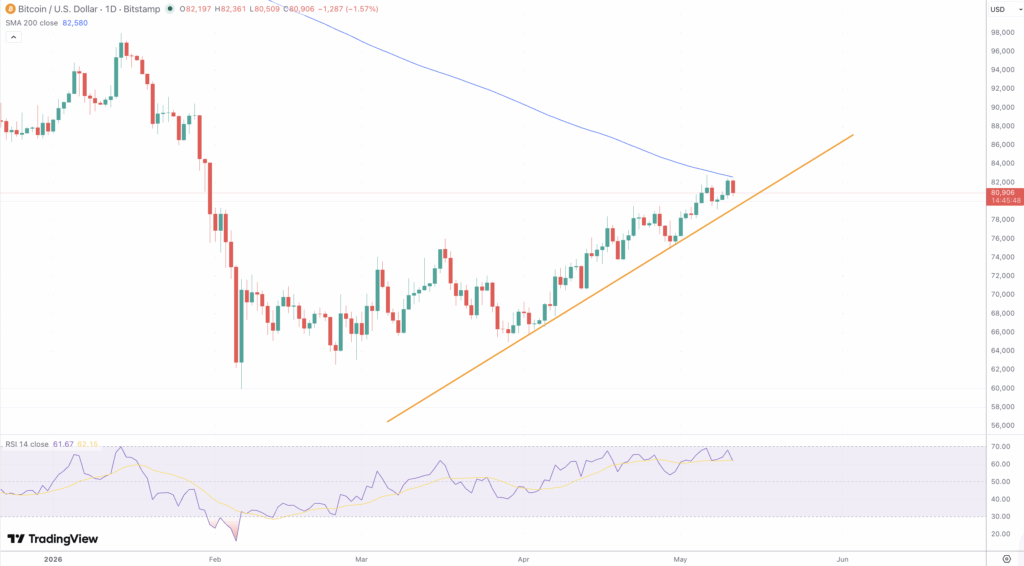
- The RSI 14 sits at 60.98 with the signal line at 62.10, indicating the signal line has edged marginally above price momentum, a mild caution flag that could precede near-term consolidation before the next leg.
- S. spot Bitcoin ETFs recorded nine consecutive sessions of net inflows totaling approximately $2.7 billion, with BlackRock’s IBIT alone contributing $251 million in a single session, and total ETF net assets surpassing $100 billion.
- Exchange-held Bitcoin has fallen to a seven-year low of approximately 2.21 million BTC, while whale wallets net-accumulated 270,000 BTC throughout April, the largest single-month total since 2013.
- Immediate resistance is clustered at $82,937 and $83,691, with a broader ceiling at $84,994; support holds at $80,880, $79,577, and the stronger structural floor at $78,823.
- The approaching Federal Reserve leadership transition on May 15, combined with sticky inflation and delayed rate-cut expectations, keeps the macro environment contested, though the dollar’s softening posture offers BTC a modest tailwind.
- A confirmed breakout above the 38.2% Fibonacci retracement of the October 2025 to February 2026 decline at approximately $86,448 would represent the next major technical milestone and open a path toward $90,000.
市場動向と直近のパフォーマンス
Bitcoin opened the week of May 11 with a session high of $82,361 before retreating to close at $80,748, a pullback of 1.76% from the day’s peak. Buyers are present and assertive enough to push price toward the upper edge of the near-term range, but supply at resistance continues to absorb those advances. The tug of war around $80,000 has been the defining feature of recent weeks, with price oscillating between $79,000 and $82,500 while the market works through overhead technical pressure against a backdrop of the strongest structural accumulation signals Bitcoin has generated in years.
Bitcoin’s cycle low of approximately $62,000, struck in early February 2026, appears well-established as the structural floor of the current phase, representing a 51% decline from the all-time high of $126,198 reached on October 6, 2025. The 30-day recovery of 17.3% is technically meaningful, though price remains roughly 36% below the cycle peak. The Fear and Greed Index, which plunged to below 26 in late April, has since recovered to approximately 46, reflecting gradual sentiment normalization without tipping into euphoria.
U.S. spot Bitcoin ETFs recorded nine straight days of positive net inflows, accumulating approximately $2.7 billion. A single session on May 5 produced $467 million, with BlackRock contributing $251 million through IBIT alone. Total net assets across the eleven U.S.-listed products have crossed $100 billion, and cumulative inflows since launch in January 2024 stand at $58.72 billion, still shy of the record $61.19 billion reached at the October 2025 peak. ETFs are absorbing new Bitcoin at a rate that materially exceeds the 450 BTC mined daily, creating structural compression in liquid supply. Bitcoin dominance is holding in the 58.9% to 61% range, with total crypto market capitalization recovering to approximately $2.81 trillion following Q1’s $900 billion drawdown.
テクニカルおよびファンダメンタル要因
The daily chart shows a price structure grinding higher along a supportive trend line since the February lows, with higher lows formed each month through March and April. The session’s intraday high of $82,361 reached into the $82,937 resistance band before rejection, a level that converges closely with the 200-day SMA at approximately $82,556, creating a dense ceiling. A sustained daily close above it would shift the long-term technical picture from bearish to constructive and typically attracts fresh systematic positioning.
Fibonacci retracement levels drawn from the October 2025 high of $126,000 to the February 2026 low of $62,000 place the 23.6% level at $77,104, the 38.2% level at $86,448, the 50% level at $94,000, and the 61.8% golden ratio level at $101,552. Current price at $80,748 sits between the 23.6% and 38.2% levels, with the first significant Fibonacci target roughly $5,700 above. A close above $86,448 would confirm the recovery has moved beyond the shallow retracement zone into more constructive Fibonacci territory.
The RSI 14 reading of 60.98, with the signal line at 62.10, sits comfortably above the 50 midline in neutral-to-bullish territory. The marginal signal line crossover above the RSI warrants monitoring as a near-term consolidation flag, though the 70 overbought threshold remains well clear, preserving meaningful room for further gains. The RSI’s recovery from near 25 in February tracks cleanly with price’s ascent from $62,000, reflecting an orderly rather than overextended advance. On the Bollinger Bands, price has been working back toward the middle band from below, consistent with a recovery not yet generating the upper band expansion that would confirm a full breakout. The ATR reflects reduced volatility relative to the February capitulation spike, and low-volatility accumulation zones historically precede impulsive directional moves. ADX is gradually reasserting trend structure from prior directionless consolidation, the Parabolic SAR has flipped above price on the session consistent with the intraday rejection from $82,361, and OBV has been trending upward since the March accumulation phase, confirming the recovery is underpinned by genuine buying pressure. The daily candle formed a shooting star-type rejection, opening near the top of its range and closing near the bottom, which at a technically dense resistance zone supports the case for a brief retest of the $79,577 to $80,880 support band before the next attempt higher.
In derivatives markets, perpetual futures funding rates have transitioned from deeply negative to neutral, clearing the speculative short overhang that had suppressed the March and April recoveries. Dealers are positioned in short gamma around $82,000, meaning their hedging adds incremental buying pressure as price rises above that level and amplifies selling if it retreats, making this zone a genuine volatility inflection point.
On-chain fundamentals are arguably the most structurally compelling since 2013. Exchange reserves stand at approximately 2.21 million BTC, a seven-year low. Wallets holding 1,000 BTC or more number 2,028 addresses, up 142 over six months, with April net accumulation totaling 270,000 BTC. Long-term holders control 78.3% of circulating supply, up from 74.1% at the year’s start, and the MVRV Z-Score at 1.2 sits well below the 3.8 cycle peak threshold. Strategy holds 818,334 BTC valued at approximately $64 billion, and the White House has signaled imminent disclosure of details on the U.S. Strategic Bitcoin Reserve. The Federal Reserve has held rates steady as major banks revise away rate-cut forecasts due to tariff-driven inflation, yet Bitcoin has continued gaining ground as its inflation-hedging narrative attracts structural adherents who view the erosion of Fed independence as a long-term tailwind. Geopolitical tensions have created episodic dips below $80,000, but these have consistently attracted buying, reinforcing $78,823 to $80,000 as a structurally defended support band.
今後の見通し
The $81,500 to $82,937 resistance band, where the 200-day SMA converges with horizontal ceiling levels and a CME futures gap around $84,000 sits just above, is the gatekeeper to the next leg of the recovery. A clean daily close above $82,937 supported by continued ETF inflows would open the door to $83,691 and then $84,994, with a breach of that upper cluster putting the 38.2% Fibonacci level at $86,448 squarely in play.
The bull case rests on continued ETF inflow momentum, a macro environment that avoids a significant shock from the Fed Chair transition, and price holding above $80,880 on intraday retreats. Seven-year-low exchange reserves, the largest monthly whale accumulation since 2013, and ETF demand exceeding daily mining output together establish a demand floor that makes sustained declines structurally difficult. The bear case centers on the rejection candle at $82,361 and the Parabolic SAR flip, arguing for at least a retest of $79,577 before upside resolution. A failure to hold $80,000 on a daily close would be a meaningful technical deterioration, with $78,823 as the critical line; a close below that level could invite a test of the $75,000 to $76,000 area where the 100-day moving average intersects with strong prior accumulation. That scenario appears lower probability given the on-chain and ETF backdrop, but Bitcoin’s macro sensitivity in 2026 means a hawkish surprise from the incoming Fed Chair could accelerate such a move rapidly.
The base case for the week is a range of $79,000 to $83,500, with structural evidence favoring a drift toward the upper end as the market digests the recent rejection and reloads for another attempt at the $82,937 to $84,994 cluster. May is shaping up as the proving ground for whether the recovery from the February lows marks the beginning of a sustained return toward $90,000 to $94,000, or a protracted consolidation below the 38.2% Fibonacci ceiling. The evidence from BlackRock and the broader ETF complex tilts the medium-term directional bias upward, even as the near-term chart structure calls for patience.