
Key Takeaways
- Bitcoin traded between $116,500 and $123,100 last week, closing near $117,200 for a 1% weekly gain.
- Price is supported by the 20‑day EMA ($116,500) and 50‑day SMA ($110,000); RSI at 58 and bullish MACD reflect continued positive momentum.
- Fibonacci levels at $112,000 (38.2%) and $107,000 (61.8%) remain key support zones from the June low–July high swing.
- Institutional flows are strong: over $3.4 billion of spot ETF inflows in July and record $57.4 billion in futures open interest.
- Watch U.S. economic data, Fed Beige Book, and crypto‑regulatory developments for the next directional trigger.
Market Dynamics and Recent Performance
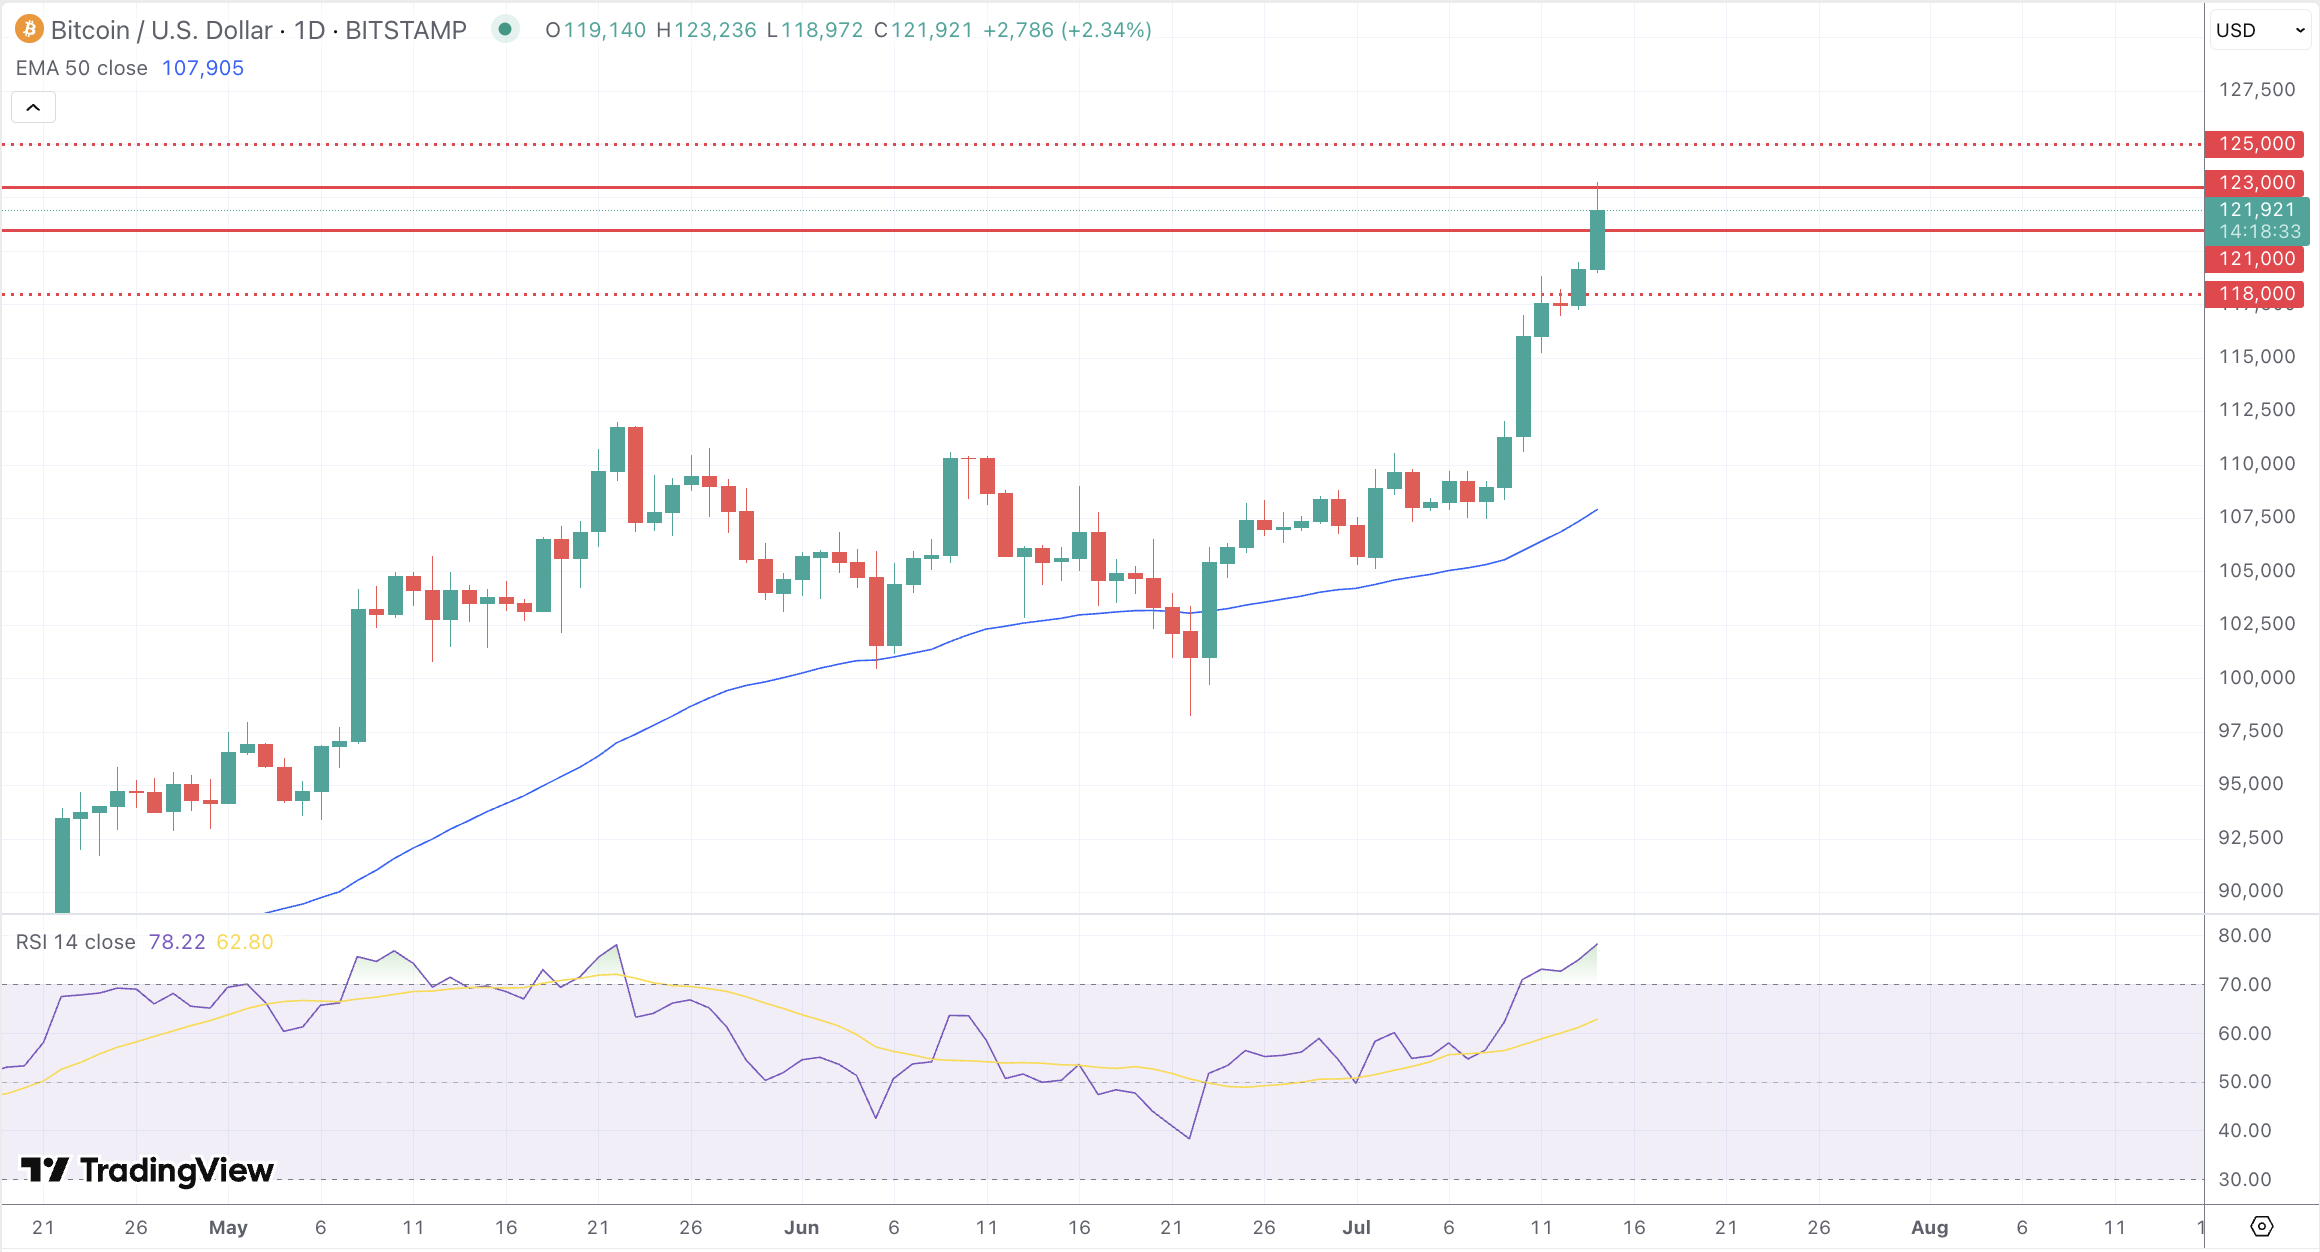
Bitcoin kicked off last week trading around $118,600 before rallying to a fresh high just above $123,100, buoyed by a surge in institutional demand. By Sunday’s close, the pair settled back near $117,200. Volatility spiked alongside record ETF inflows and on‑chain activity, with price action confined largely between $116,500 support and $123,000 resistance. This tight range highlights the market’s effort to absorb significant capital flows without breaking clear directional bias.
Technical and Fundamental Influences
Technically, BTC/USD is holding above its 20‑day exponential moving average, currently near $116,500, which has offered reliable support on four successive tests. The 50‑day simple moving average sits around $110,000, well below spot, confirming that the medium‑term uptrend remains intact. The daily Relative Strength Index hovers at 65, indicating bullish momentum without overbought extremes, while the MACD histogram shows expanding positive bars following a bullish crossover ten days ago. Key Fibonacci retracements drawn from the late June low at $102,200 to last week’s peak at $123,100 place the 38.2% retracement at $113,000 and the 61.8% level at $107,000, both of which have so far held firm.
On the fundamental side, U.S. spot Bitcoin ETFs attracted over $3.4 billion in inflows so far this month, with a record $2.2 billion pouring in over just two days. Open interest in BTC futures surged to roughly $57.4 billion, underscoring growing participation by large investors. Funding rates have retraced to 10%, a fraction of earlier peaks, while the estimated leverage ratio has fallen to around 0.25, signaling that much of the rally is underpinned by real capital rather than borrowed funds. Meanwhile, Bitcoin’s market‑cap dominance briefly dipped below 61%, reflecting altcoin strength, but the pullback in BTC dominance has so far failed to derail the primary uptrend.
Looking Forward
In the coming week, markets will be watching U.S. housing starts, leading economic indicators and the Federal Reserve’s Beige Book for clues on growth and monetary policy. A sustained break above $123,500 could open the path toward the $130,000 psychological level, with further resistance around $135,000, where a cluster of sell‑orders has been reported. Conversely, if BTC fails to defend the $116,500 zone, a deeper correction toward $112,000 may unfold, with the 50‑day SMA near $110,000 as the next buffer. Regulatory developments, including any progress on federal crypto legislation during “Crypto Week,” and shifts in global risk appetite will remain critical catalysts for near‑term volatility.
