
Key Takeaways
- BTC starts the week at 111,280 after losing the 112,000 shelf, shifting the short-term tone to cautious.
- Daily momentum is muted. RSI sits near the midline, ADX is weak, and Bollinger Bands are tight, favoring range behavior.
- Volume profile highlights 112,000 to 112,500 as the first hurdle and a thin pocket around 110,500 to 110,000 that can accelerate moves.
- Event risk is concentrated on Thursday’s GDP update and Friday’s PCE. Softer data would typically aid a recovery toward 114,000 then 116,000 to 118,000, while firmer data would keep BTC near the lower half of the August range.
Market Dynamics and Recent Performance
BTC slipped to 111,280 to start the week after weekend selling pressure knocked price through the 112,000 shelf. The broader backdrop remains macro-sensitive into Thursday’s US GDP second estimate and Friday’s PCE inflation, with swings in real yields and the dollar still steering crypto risk appetite. Until those releases, price action looks biased toward range trading inside the August pullback from mid-month highs.
Technical and Fundamental Influences
Trend and momentum lean neutral-to-soft on the daily chart. Price sits below the short-term moving averages, while the longer-term trend structure remains intact on higher time frames. Daily RSI hovers near the midline, and ADX is subdued, which together signals consolidation rather than a directional trend.
Volatility has compressed. Bollinger Bands tightened compared with mid-August, and price is probing the lower band area, a pattern that often precedes mean-reversion pops unless sellers extend the break with strong follow-through.
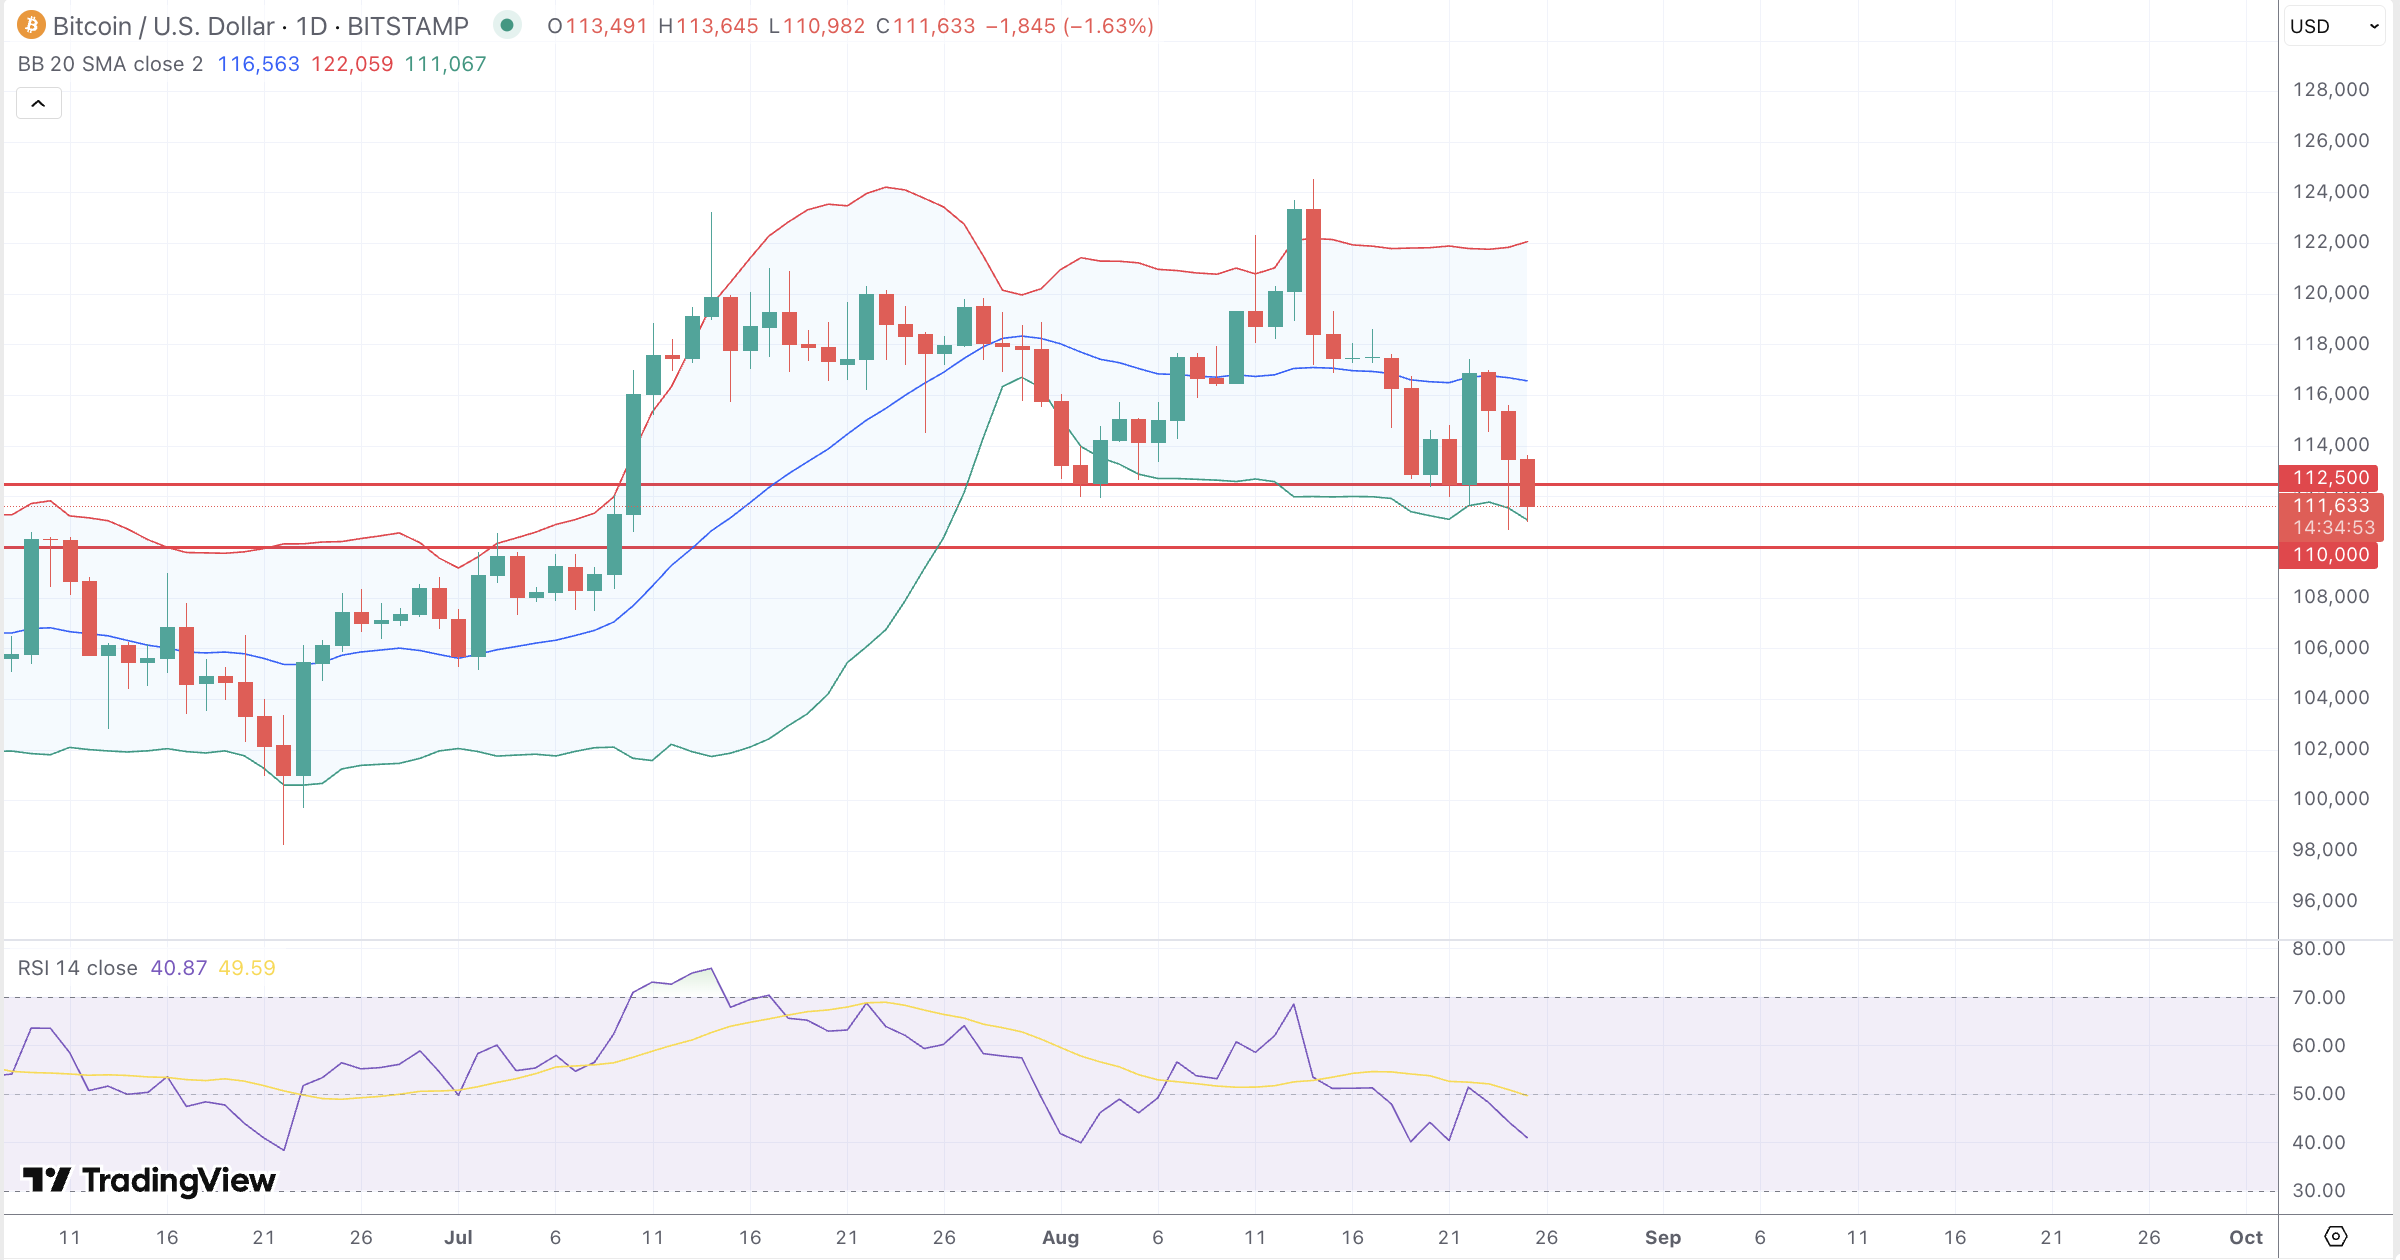
Volume and positioning cues point to clear battlegrounds. The visible range shows a high-participation node around 112,000 to 112,500, which flipped from support to resistance after the weekend slide. Below spot, a thinner pocket sits around 110,500 to 110,000, where price has tended to move quickly when tested. Intraday structure on the 4-hour chart shows lower highs against a flat base, typical of a corrective phase rather than a trend reversal.
Short-term moving averages are stacked just above spot, creating a ceiling between 112,000 and 114,000. The 200-day average is still well below current price, which preserves the long-term bullish bias unless the market breaks down decisively.
Catalysts remain binary. Softer PCE would typically pressure real yields and the dollar, improving the tone for BTC. A firmer inflation print or upside growth revision would likely keep BTC pinned in the lower half of August’s range.
Looking Forward
Bias is neutral to mildly bearish while BTC trades below 112,300. A quick reclaim of 112,000 to 112,300 would warn of a bear trap and favor a squeeze toward 114,000, then the anchored VWAP and supply band at 116,000 to 118,000. Failure to retake 112,000 keeps focus on 111,100 to 111,400 first, then 110,500 to 110,000. Clean acceptance below 110,000 would open 109,200 to 108,800, where a bounce attempt is likely on first touch. With daily volatility compressed, expect sharp but contained swings around these levels until data reset the macro tone.
