
Key Takeaways
- Below Key Moving Average: Bitcoin trading at $106,108, below the critical 200-day SMA at $110,367, with RSI at 45.91 indicating bearish momentum. Reclaiming $110,367 is essential to restore bullish structure.
- ETF Flow Reversal: $240 million inflows on November 7 ended six-day outflow streak that drained $2.04 billion, led by BlackRock ($112.44M) and Fidelity ($61.64M). Historical pattern suggests potential market bottom formation similar to June 2025.
- Key Resistance Levels: Immediate barrier at $107,000-$108,000, then critical 200-day SMA at $110,367. Additional resistance at $112,000-$113,000, $116,000-$118,000, and $120,000. Must reclaim 200-day SMA to shift momentum bullish.
- Support Structure: Support at $104,000-$105,000, then $102,000-$103,000, followed by $100,000 psychological level. Break below $100,000 targets $95,000-$98,000.
- Institutional Adoption: 172 public companies hold BTC with $139.15 billion in ETF assets (6.72% of market cap). Major institutions like JPMorgan (+64% IBIT holdings) signal strategic positioning despite short-term volatility.
- Technical Setup: RSI at 45.91 below neutral 50 indicates sellers maintain control. Price below 200-day SMA ($110,367) confirms bearish technical structure. MACD showing signs of bottoming but lacks conviction.
- Shutdown Impact: US government closure draining liquidity contributed to 5% Bitcoin decline. Resolution expected mid-November could flood markets with liquidity, creating favorable recovery conditions. Polymarket: 50% chance extends beyond November 16.
- Market Sentiment: Fear & Greed Index at 22 (Extreme Fear) signals capitulation often preceding bottoms. Long-term holders sold 325,000 BTC ($35B) in October, creating supply pressure now potentially exhausted.
- Trading Strategy: Bulls need to reclaim $110,367 (200-day SMA) with stops below $104,000. Resistance trades at 200-day SMA and $112,000-$113,000. Watch for RSI cross above 50 to confirm momentum shift.
- Outlook Probabilities: Base case (45%) sees consolidation between $104,000-$110,000 attempting to reclaim 200-day SMA. Bullish (30%) breaks above $110,367 targeting $112,000-$116,000. Bearish (25%) rejects at $107,000-$110,000, retesting $100,000-$102,000 support.
Market Dynamics and Recent Performance
Bitcoin trades near $106,108 following a volatile October that saw the cryptocurrency surge to an all-time high of $126,296 on October 6 before correcting 21% over 31 days. The digital asset briefly dipped below the psychological $100,000 level to $98,900 on November 6, marking its lowest point since June 2025, before recovering to current levels. While this represents a 7% bounce from the lows, Bitcoin remains below the critical 200-day Simple Moving Average at $110,367, maintaining a technically vulnerable position.
The correction from the October peak has been characterized by range-bound trading between $100,000 and $113,000, with declining volatility signaling market indecision. Despite the 20% pullback, Bitcoin maintains a robust 2025 performance, having surged approximately 50% year-to-date. Current price action around $106,108 sits at a critical juncture, trading below the 200-day SMA for the first time in months—a bearish technical signal that bulls must reverse to restore the longer-term uptrend structure. The 50-day SMA at $114,200 represents even more substantial overhead resistance that must be reclaimed for continuation higher.
Technical and Fundamental Influences
Technical indicators present a bearish to neutral picture. The Relative Strength Index reads 45.91 on the daily chart, sitting below the neutral 50 level and indicating sellers maintain slight control. This positioning suggests Bitcoin needs to reclaim RSI 50 to shift momentum bullish. On higher timeframes, the weekly RSI at 63.48 remains constructive, reflecting the longer-term uptrend intact despite recent correction.
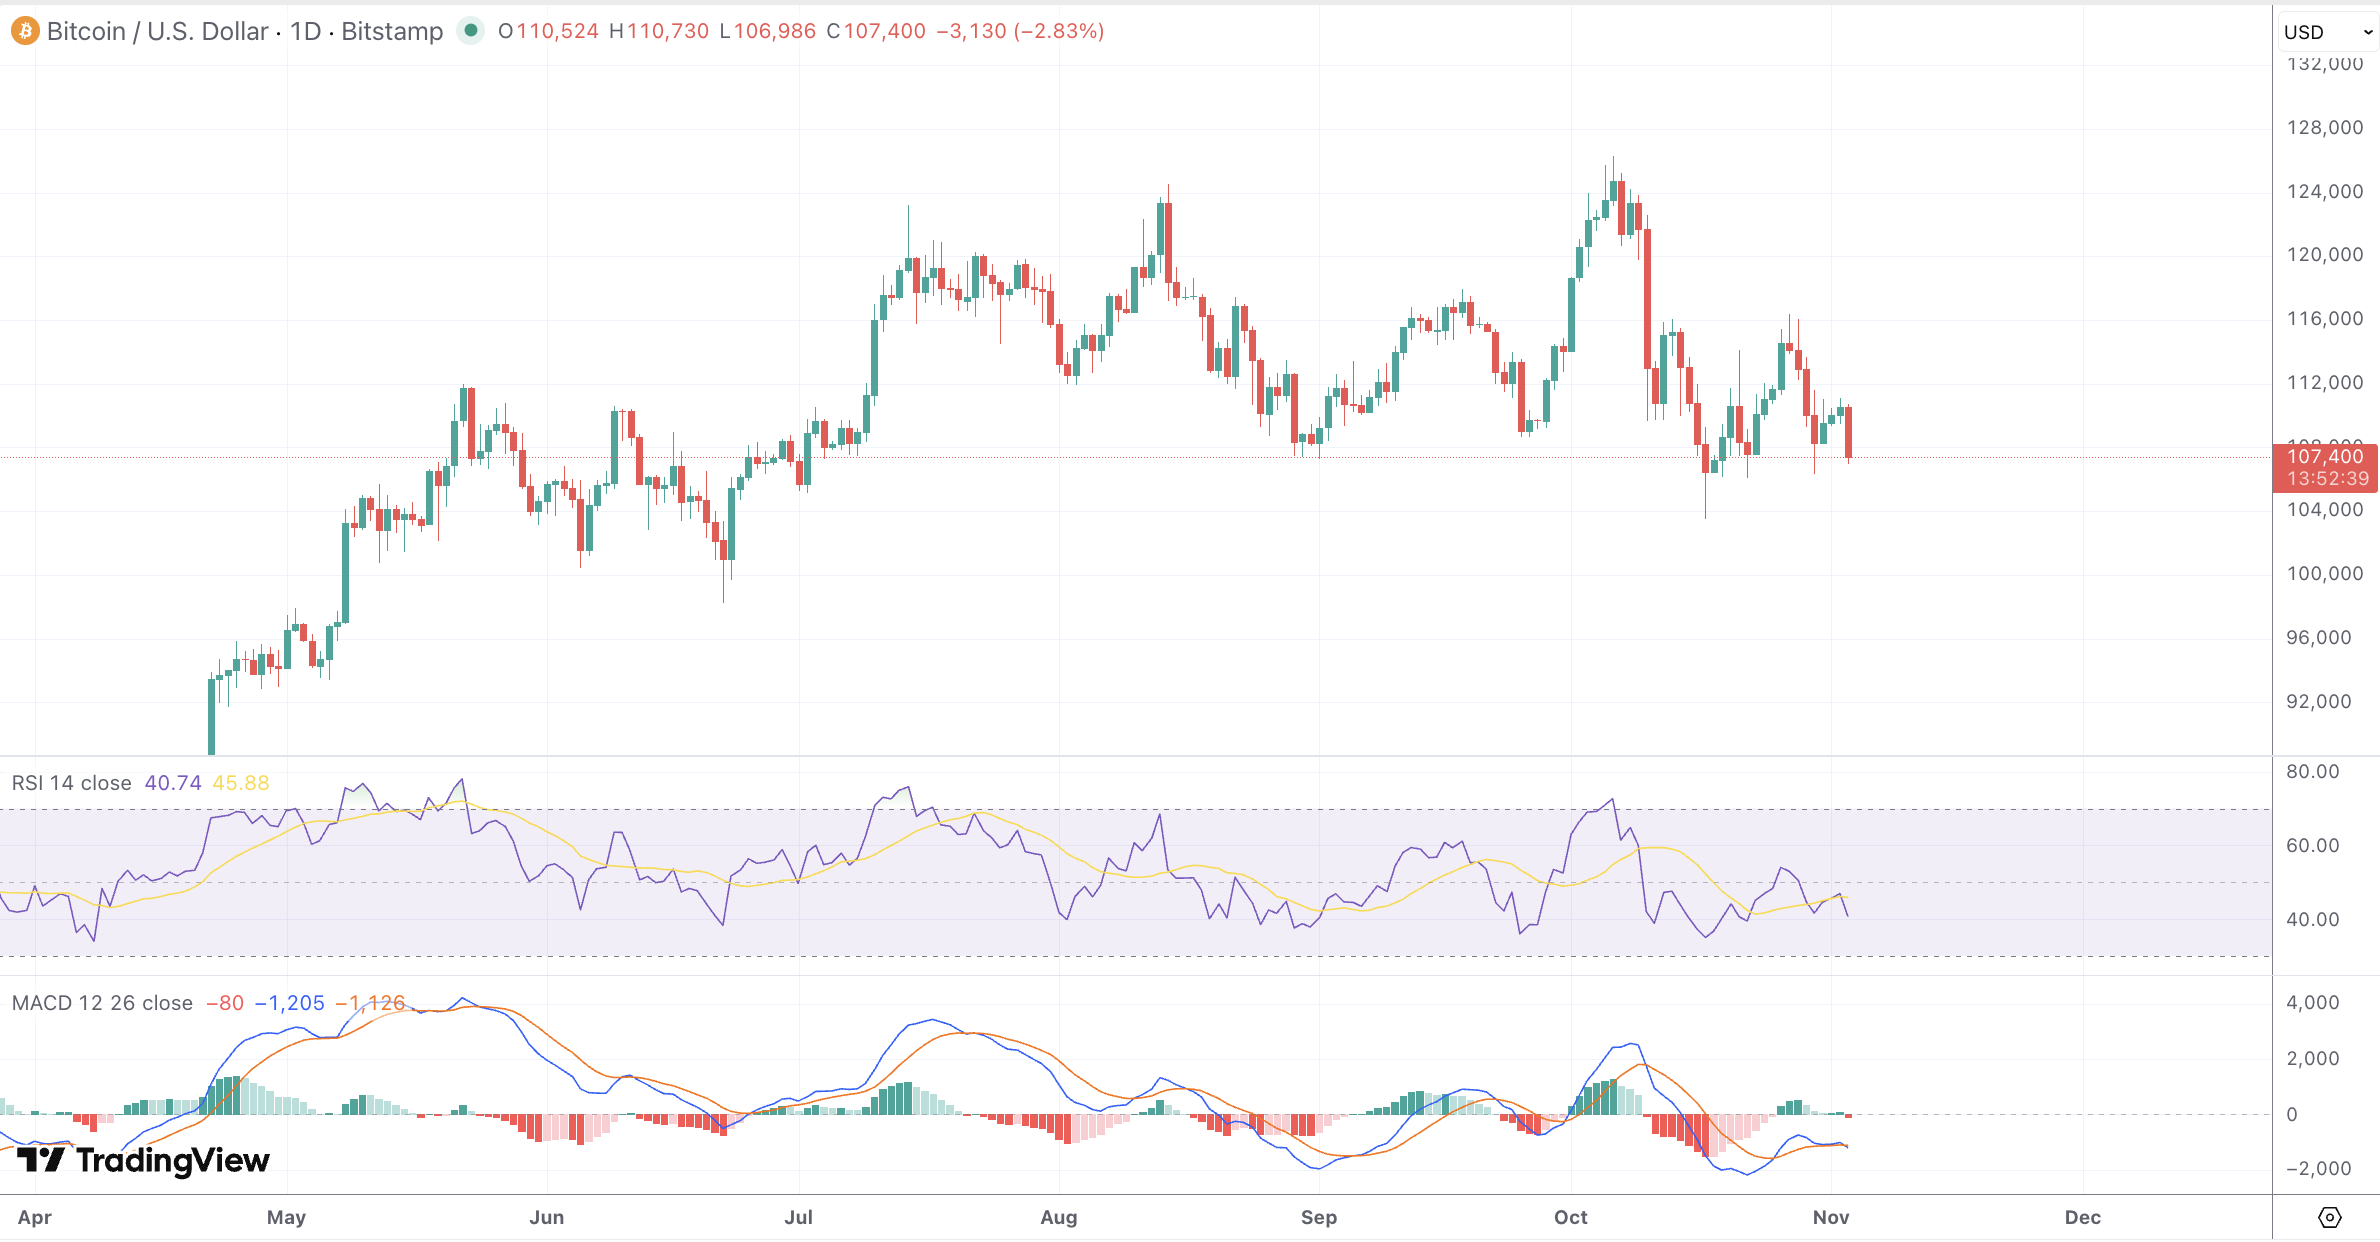
The MACD shows gradual improvement from recent weakness. While the indicator remains slightly positive, the histogram shows signs of bottoming, suggesting momentum deceleration may be concluding. Critically, Bitcoin at $106,108 trades below the 200-day SMA at $110,367, a bearish technical configuration indicating the long-term trend has weakened. Price must reclaim this key moving average to restore bullish structure. The 50-day SMA at $114,200 represents even more substantial overhead resistance.
Support levels are clearly defined at $104,000-$105,000, followed by $102,000-$103,000, then $100,000 (psychological). Resistance stands at $107,000-$108,000 initially, then the critical 200-day SMA at $110,367, followed by $112,000-$113,000, with major barriers at $116,000-$118,000 and $120,000. A reclaim above the 200-day SMA ($110,367) would be the first technical signal of strength, while a move above $121,000 would confirm the correction has concluded.
On fundamentals, institutional dynamics dominate the narrative. Bitcoin ETF flows reversed dramatically after a six-day outflow streak that saw $2.04 billion exit the market. Thursday, November 7 marked a turning point with $240 million in inflows, led by BlackRock’s IBIT with $112.44 million and Fidelity’s FBTC with $61.64 million. This reversal ended the longest outflow streak since launch and historically correlates with market bottoms, similar to the June 2025 pattern where Bitcoin bottomed at $100,000 before surging to $123,500 within three weeks.
Despite the recent inflows, ETF activity remains modest compared to earlier 2025 cycles, with daily volumes below 1,000 BTC versus 2,500 BTC during peak periods. Total Bitcoin ETF assets under management stand at $139.15 billion, representing 6.72% of Bitcoin’s total market cap. Cumulative net inflows have reached $60.28 billion since launch, demonstrating sustained institutional adoption despite periodic volatility.
The broader institutional landscape shows maturation. As of 2025, 172 public companies hold Bitcoin on their balance sheets, with 59% of institutional investors allocating at least 10% of portfolios to digital assets. Major wealth managers including Morgan Stanley, Wells Fargo, UBS, and Merrill Lynch now permit advisor allocation to Bitcoin ETFs. JPMorgan increased its IBIT holdings by 64% in Q3 2025 to $343.5 million despite CEO skepticism, signaling strategic positioning by major institutions.
The ongoing US government shutdown presents both headwinds and tailwinds. The closure has drained liquidity from markets as the Treasury General Account freezes funds, contributing to Bitcoin’s 5% decline during the shutdown period. However, resolution expected by mid-November would flood markets with liquidity, creating favorable conditions for recovery. Polymarket assigns 50% probability to shutdown extending beyond November 16, maintaining uncertainty.
Long-term holders sold over 325,000 BTC valued at $35 billion in October, creating supply pressure that has capped recovery attempts. This distribution from profit-taking contrasts with institutional accumulation, resulting in choppy price action. The Fear & Greed Index registers 22 (Extreme Fear), indicating capitulation that often precedes market bottoms.
Looking Forward
With price at $106,108 and RSI at 45.91, Bitcoin faces significant overhead resistance. The immediate challenge is the $107,000-$108,000 zone, but more critically, the 200-day SMA at $110,367 represents a key technical hurdle. Trading below this moving average keeps the bearish structure intact. A reclaim above $110,367 combined with RSI crossing above 50 would significantly improve the outlook and target $112,000-$113,000.
The base case (45% probability) sees continued consolidation between $104,000-$110,000 as Bitcoin attempts to reclaim the 200-day SMA. This scenario requires sustained ETF inflows and the government shutdown resolution to provide liquidity support. Failure to break above $110,367 suggests extended range-bound trading. The bullish scenario (30% probability) envisions a decisive break above the 200-day SMA toward $112,000-$116,000, contingent on strong catalysts like shutdown resolution and accelerating institutional buying.
The bearish scenario (25% probability) involves rejection at $107,000-$110,000 resistance triggering a retest of $102,000-$104,000 support, then potentially $100,000. Trading below the 200-day SMA increases downside risk, with a breakdown below $100,000 targeting $95,000-$98,000.
