
Key Takeaways:
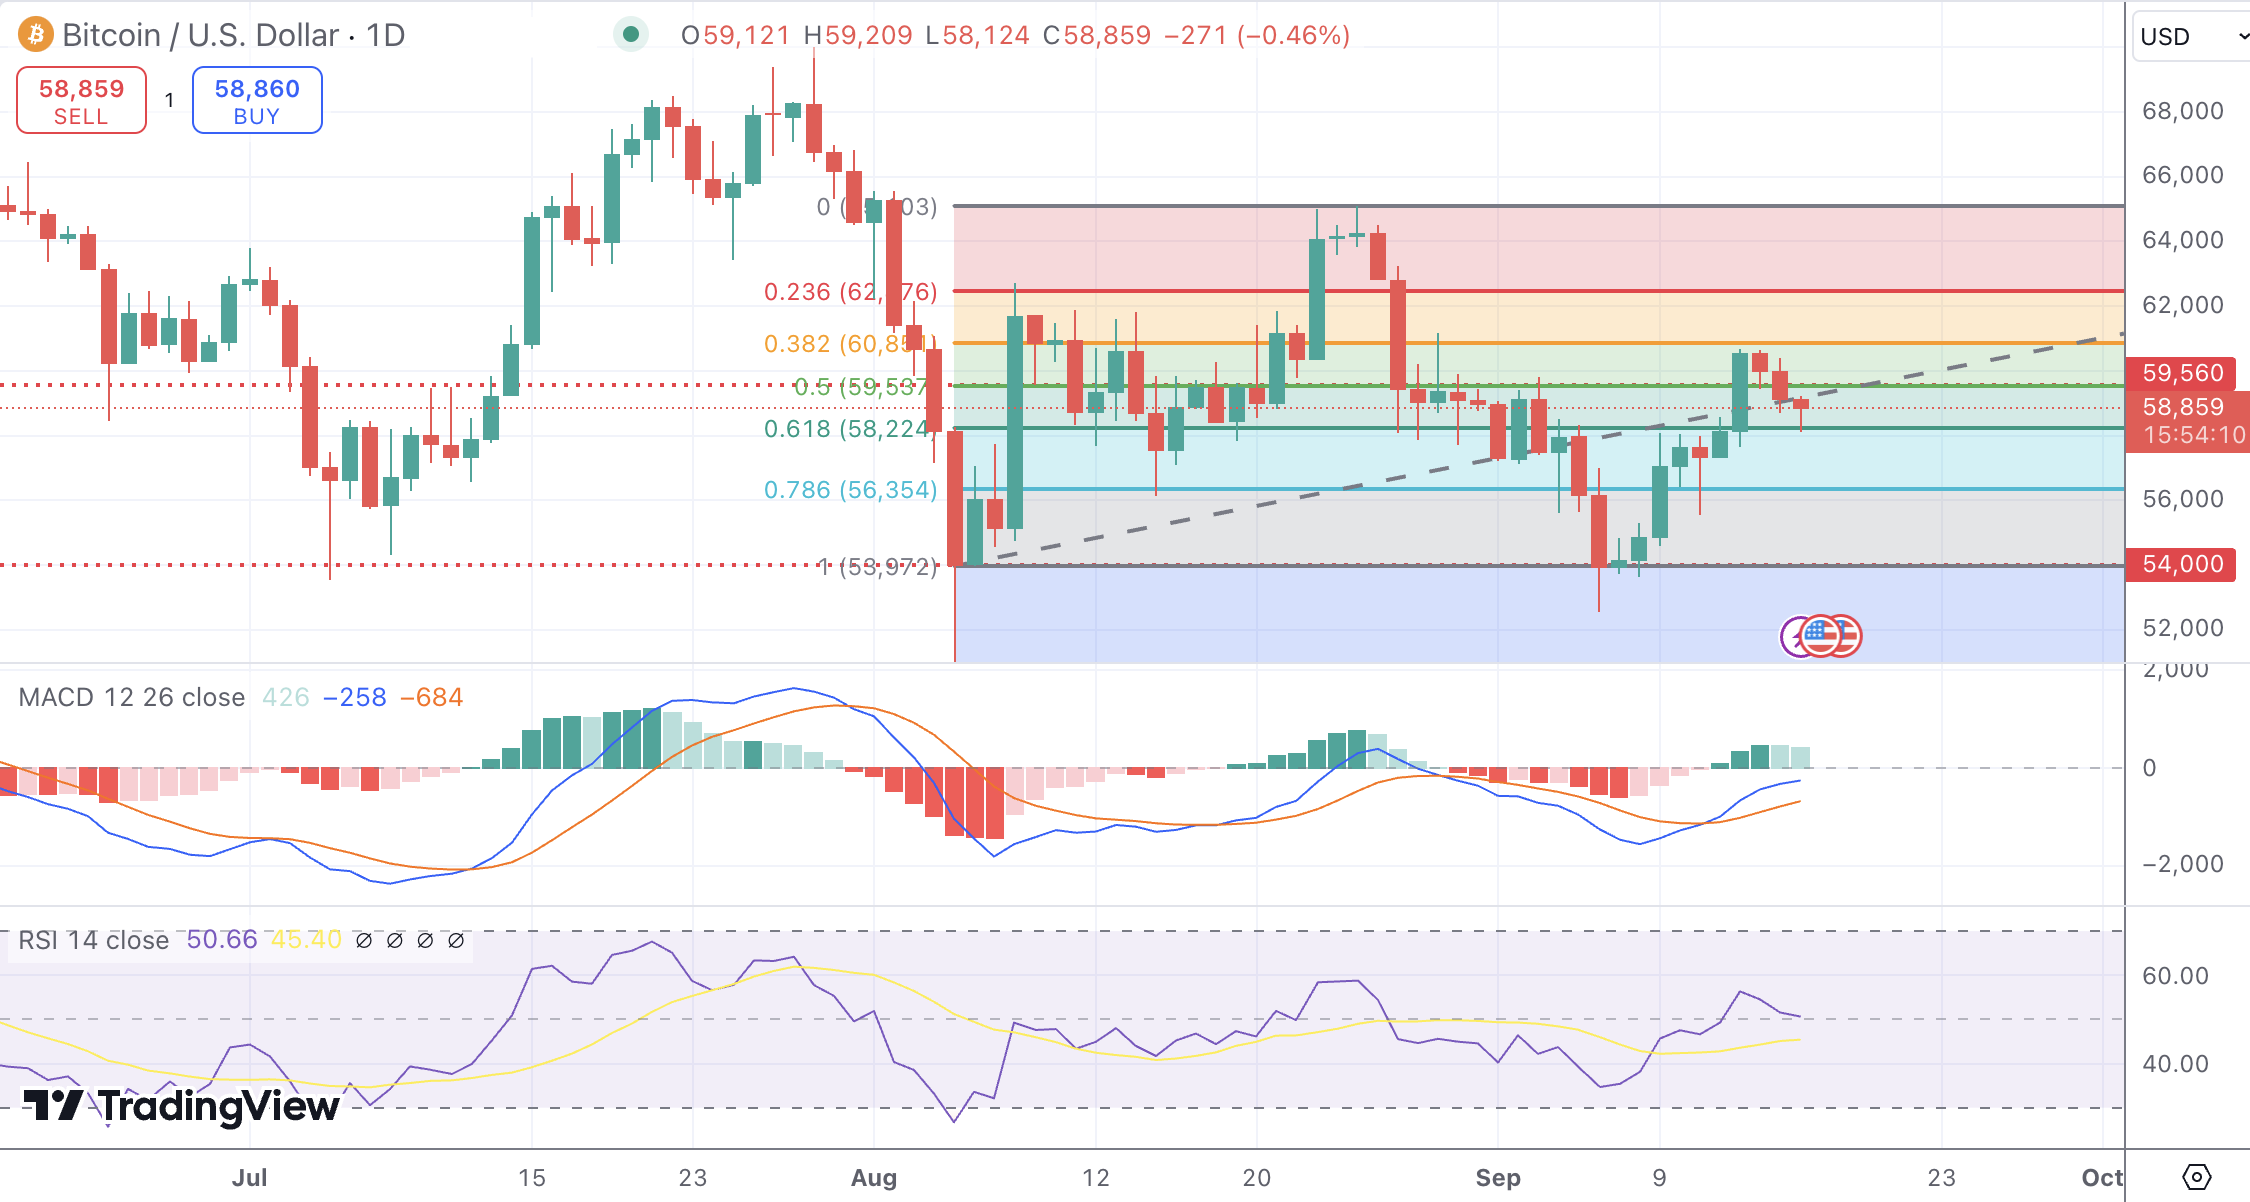
- Bitcoin is currently trading around $58,000, with key support at $56,000 and resistance at $60,000.
- Technical indicators such as the MACD suggest bullish momentum, while the RSI remains neutral.
- Institutional inflows into Bitcoin ETFs and accumulation on exchanges indicate growing demand.
- The Federal Reserve’s upcoming rate decision could be a pivotal factor in Bitcoin’s near-term price direction.
- A break above $60,000 could open the door to further gains, with $62,000 as the next potential target, while a drop below $56,000 could signal a return to $54,000.
Market Dynamics and Recent Performance
Bitcoin (BTC) has been steadily recovering over the past week, bouncing off a critical support level near $56,000. The cryptocurrency has gained approximately 6%, reaching a current trading range around $58,000. Despite this upward movement, Bitcoin has encountered some resistance, with analysts closely watching the $60,000 level as the next significant hurdle. A potential rally beyond this point would mark a critical psychological milestone for both traders and investors, supported by inflows into US-listed Bitcoin ETFs. These ETFs saw a net inflow of $140.7 million this week, indicating a mild increase in institutional demand.
The market’s overall momentum remains cautiously optimistic, though some technical indicators suggest lingering volatility. Over the last few months, Bitcoin’s price action has been marked by periods of sideways movement, with bouts of both enthusiasm and skepticism among traders. As the market awaits the next Federal Reserve meeting, the potential impact of macroeconomic factors like interest rate cuts looms large.
Technical and Fundamental Influences
Technically, Bitcoin’s price structure remains in an upward trend, supported by on-chain metrics that signal a favorable outlook. According to data from Coinglass, the Exchange Flow Balance has moved deeper into negative territory, reflecting heightened buying activity. This indicator tracks the movement of Bitcoin into and out of exchange wallets, with negative values indicating more BTC exiting exchanges—a sign that investors are accumulating the cryptocurrency. The Supply on Exchanges index also dipped slightly, from 1.89 million BTC to 1.86 million, reinforcing the accumulation trend.
In addition, the Moving Average Convergence Divergence (MACD) indicator supports a bullish outlook. A crossover occurred on the daily chart, with the MACD line moving above the signal line, signaling upward momentum. Meanwhile, the Relative Strength Index (RSI) hovers near the neutral level, reflecting a market that has yet to fully commit to a sustained trend.
On the fundamental side, institutional interest remains a key driver of Bitcoin’s recent recovery. ETF inflows, coupled with on-chain accumulation, point to a gradual shift in sentiment. Deutsche Bank analysts have also projected a positive outlook for Bitcoin, citing factors like regulatory changes, potential central bank rate cuts, and pro-crypto policies as key drivers for further price appreciation. These elements contribute to the broader narrative that Bitcoin is being increasingly seen as a store of value and a viable alternative asset.
Looking Forward
In the week ahead, the Federal Reserve’s decision on interest rates will likely be a major catalyst for Bitcoin’s price movement. Market participants are divided on whether the Fed will opt for a 25-basis-point or 50-basis-point rate cut. A larger cut would likely boost risk assets, including cryptocurrencies, providing the momentum Bitcoin needs to push past the $60,000 barrier. However, a more conservative cut may introduce some uncertainty into the market, leaving traders wary of overcommitting to long positions.
Technically, Bitcoin will need to maintain its position above the $56,000 support level to sustain its current upward trajectory. A failure to hold this level could lead to a pullback toward the $54,000 mark, a critical psychological support zone. Conversely, if BTC successfully breaks through the $60,000 level, it could trigger a rally toward the $62,000–$64,000 range, with the next resistance likely forming around these levels.
The correlation between Bitcoin and traditional assets like gold and the US dollar will also be important to watch. Recently, the correlation between Bitcoin and gold has weakened, signaling a risk-averse market environment where investors favor traditional safe-haven assets. Similarly, the US dollar’s weakening has not translated into Bitcoin strength, raising concerns about broader market sentiment.
