
As we journey back to the end of January and the dawn of February, the Bitcoin market presented a tapestry of technical signals and economic sentiments that shaped its trajectory. The period was marked by fluctuations, anticipations, and strategic positioning by investors, all under the watchful eyes of global economic developments.
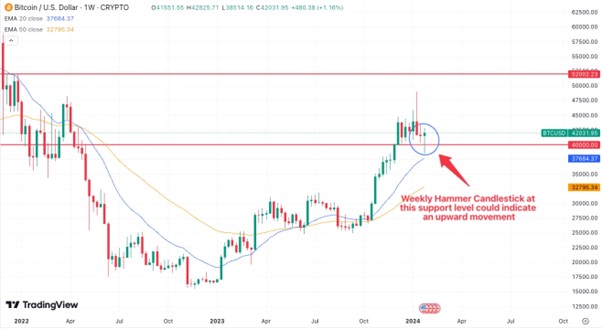
At the close of January, Bitcoin’s price movements were closely intertwined with key technical indicators, notably the 20-day and 50-day Exponential Moving Averages (EMAs). These EMAs served as critical junctures, influencing investor decisions and market direction. The $40,000 mark stood out as a significant support level, bolstered further by the 50-day EMA’s underlying strength. This confluence of technical support hinted at a robust safety net for Bitcoin, suggesting potential buying opportunities for those seeking value in market dips.
The anticipation of the Federal Open Market Committee (FOMC) meeting added another layer of intrigue, with potential implications for Bitcoin’s correlation with broader economic policies. As the market teetered on the brink of these technical and fundamental influences, the overarching narrative was one of cautious optimism, underscored by a readiness to capitalize on pullbacks and an eye towards resistance levels at $45,000 and beyond.
Reflecting on Market Dynamics
The days leading up to the turn of the month saw Bitcoin’s resilience tested, with rallies and pullbacks painting a picture of a market in search of direction. The $40,000 to $38,000 range emerged as a battleground for support, while the upside saw resistance forming at higher echelons, particularly around the $47,500 mark. This period was characterized by a blend of recovery from preceding declines and the anticipation of future gains, driven by a mix of technical analysis and market sentiment.
The narrative was further complicated by the FOMC’s stance, with potential dovish or hawkish signals poised to sway the market. Investors and traders alike were on high alert, ready to interpret these cues and align their strategies accordingly.
Looking Back at the Technical Landscape
The technical analysis of Bitcoin during this period revealed a market in flux but with underlying bullish undertones. The formation of a weekly hammer candlestick at crucial support levels and the interaction with key EMAs painted a picture of a market on the cusp of a potential upward movement. The daily charts echoed this sentiment, with resistance levels being tested and the possibility of a shift towards the $52,000 horizon if certain thresholds were breached.
This retrospective glimpse into Bitcoin’s market dynamics highlights the intricate dance between technical indicators, economic events, and investor sentiment. As the market navigated through these layers of complexity, the overarching theme was one of strategic positioning, with the aim of harnessing potential opportunities amidst the volatility.
Conclusion
The journey through the final days of January and the onset of February was a testament to the ever-evolving narrative of Bitcoin. As the market grappled with technical levels, economic signals, and the broader quest for value, the period served as a microcosm of the larger forces at play in the cryptocurrency domain. Looking back, this phase offered valuable insights into the interplay of support and resistance levels, the impact of macroeconomic events, and the perpetual search for opportunities in the undulating terrain of Bitcoin trading.
