
Key Takeaways
- Current Price Action: Bitcoin trades at $111,121, down 11.9% from October 6 all-time high of $126,198; holding above critical 200-day EMA support at $106,000-$108,000 in a positive sign for bulls
- Technical Levels: Immediate support at $108,000, $106,548, $105,967; critical 200-day EMA floor at $106,000-$108,000; resistance at $112,000, $114,000-$115,000 EMA cluster, and 20-day MA at $116,541
- Chart Patterns: Double-bottom formation with neckline at $117,300 projects $127,500 target; symmetrical triangle suggests imminent volatility expansion; current price above $108,000 support maintains bullish structure
- Momentum Indicators: RSI at 36.80 (neutral, recovering from oversold); MACD flattening suggests building buying pressure; trading between 200-day EMA support ($108,000) and 20-day MA resistance ($116,541)
- ETF Flows: Early October saw record $3.24 billion weekly inflows; reversed to $530.9 million outflow October 16; BlackRock’s IBIT dominates with $88 billion AUM; CME futures surpass Binance at $16.67 billion
- On-Chain Metrics: Long-term holder SOPR at 2.32 (132% average profit); exchange reserves at 6-year lows; accumulation by 1-1,000 BTC holders continues despite correction
- Fed Policy: October 28-29 FOMC meeting expected to deliver 25bp cut; Powell’s dovish stance supports risk assets; October 24 CPI report critical for policy expectations
- Week Ahead Catalysts: CPI data October 24; Fed/ECB meetings October 28-30; historical Q4 seasonality favors Bitcoin with 80% average returns since 2013
Bitcoin trades near $111,121 as of October 20, consolidating after a sharp correction from its all-time high of $126,198 reached on October 6. The flagship cryptocurrency has successfully defended critical support levels and now trades above the key 200-day EMA, suggesting buyers remain engaged despite recent profit-taking and shifting institutional sentiment. While long-term holders realize substantial gains and ETF flows turn volatile, technical indicators suggest the market is coiling for its next major move.
Market Dynamics and Recent Performance
Bitcoin’s price action has been turbulent throughout October, declining approximately 11.9% from its peak above $126,000 to current levels around $111,000. The cryptocurrency surged to record highs in early October fueled by massive institutional ETF inflows exceeding $3.24 billion during the first week alone, with BlackRock’s IBIT attracting nearly $1 billion in a single session on October 7. Subsequent profit-taking pushed prices lower, though Bitcoin has stabilized above the critical 200-day EMA, demonstrating resilient demand. ETF flows turned volatile mid-month, with a substantial $530.9 million outflow recorded on October 16, yet the successful defense of key support suggests institutional conviction remains intact.
On-chain data reveals strong accumulation by smaller holders (1-1,000 BTC) despite the price decline, suggesting institutional and retail investors view current levels as attractive entry points. The Spent Output Profit Ratio for long-term holders hit 2.32, indicating average realized gains of 132%, yet shorter-term metrics suggest selling pressure may be easing. CME Bitcoin futures open interest surpassed Binance’s for the first time at $16.67 billion, signaling growing institutional preference for regulated venues and enhancing Bitcoin’s credibility as a mainstream asset.
Technical and Fundamental Influences
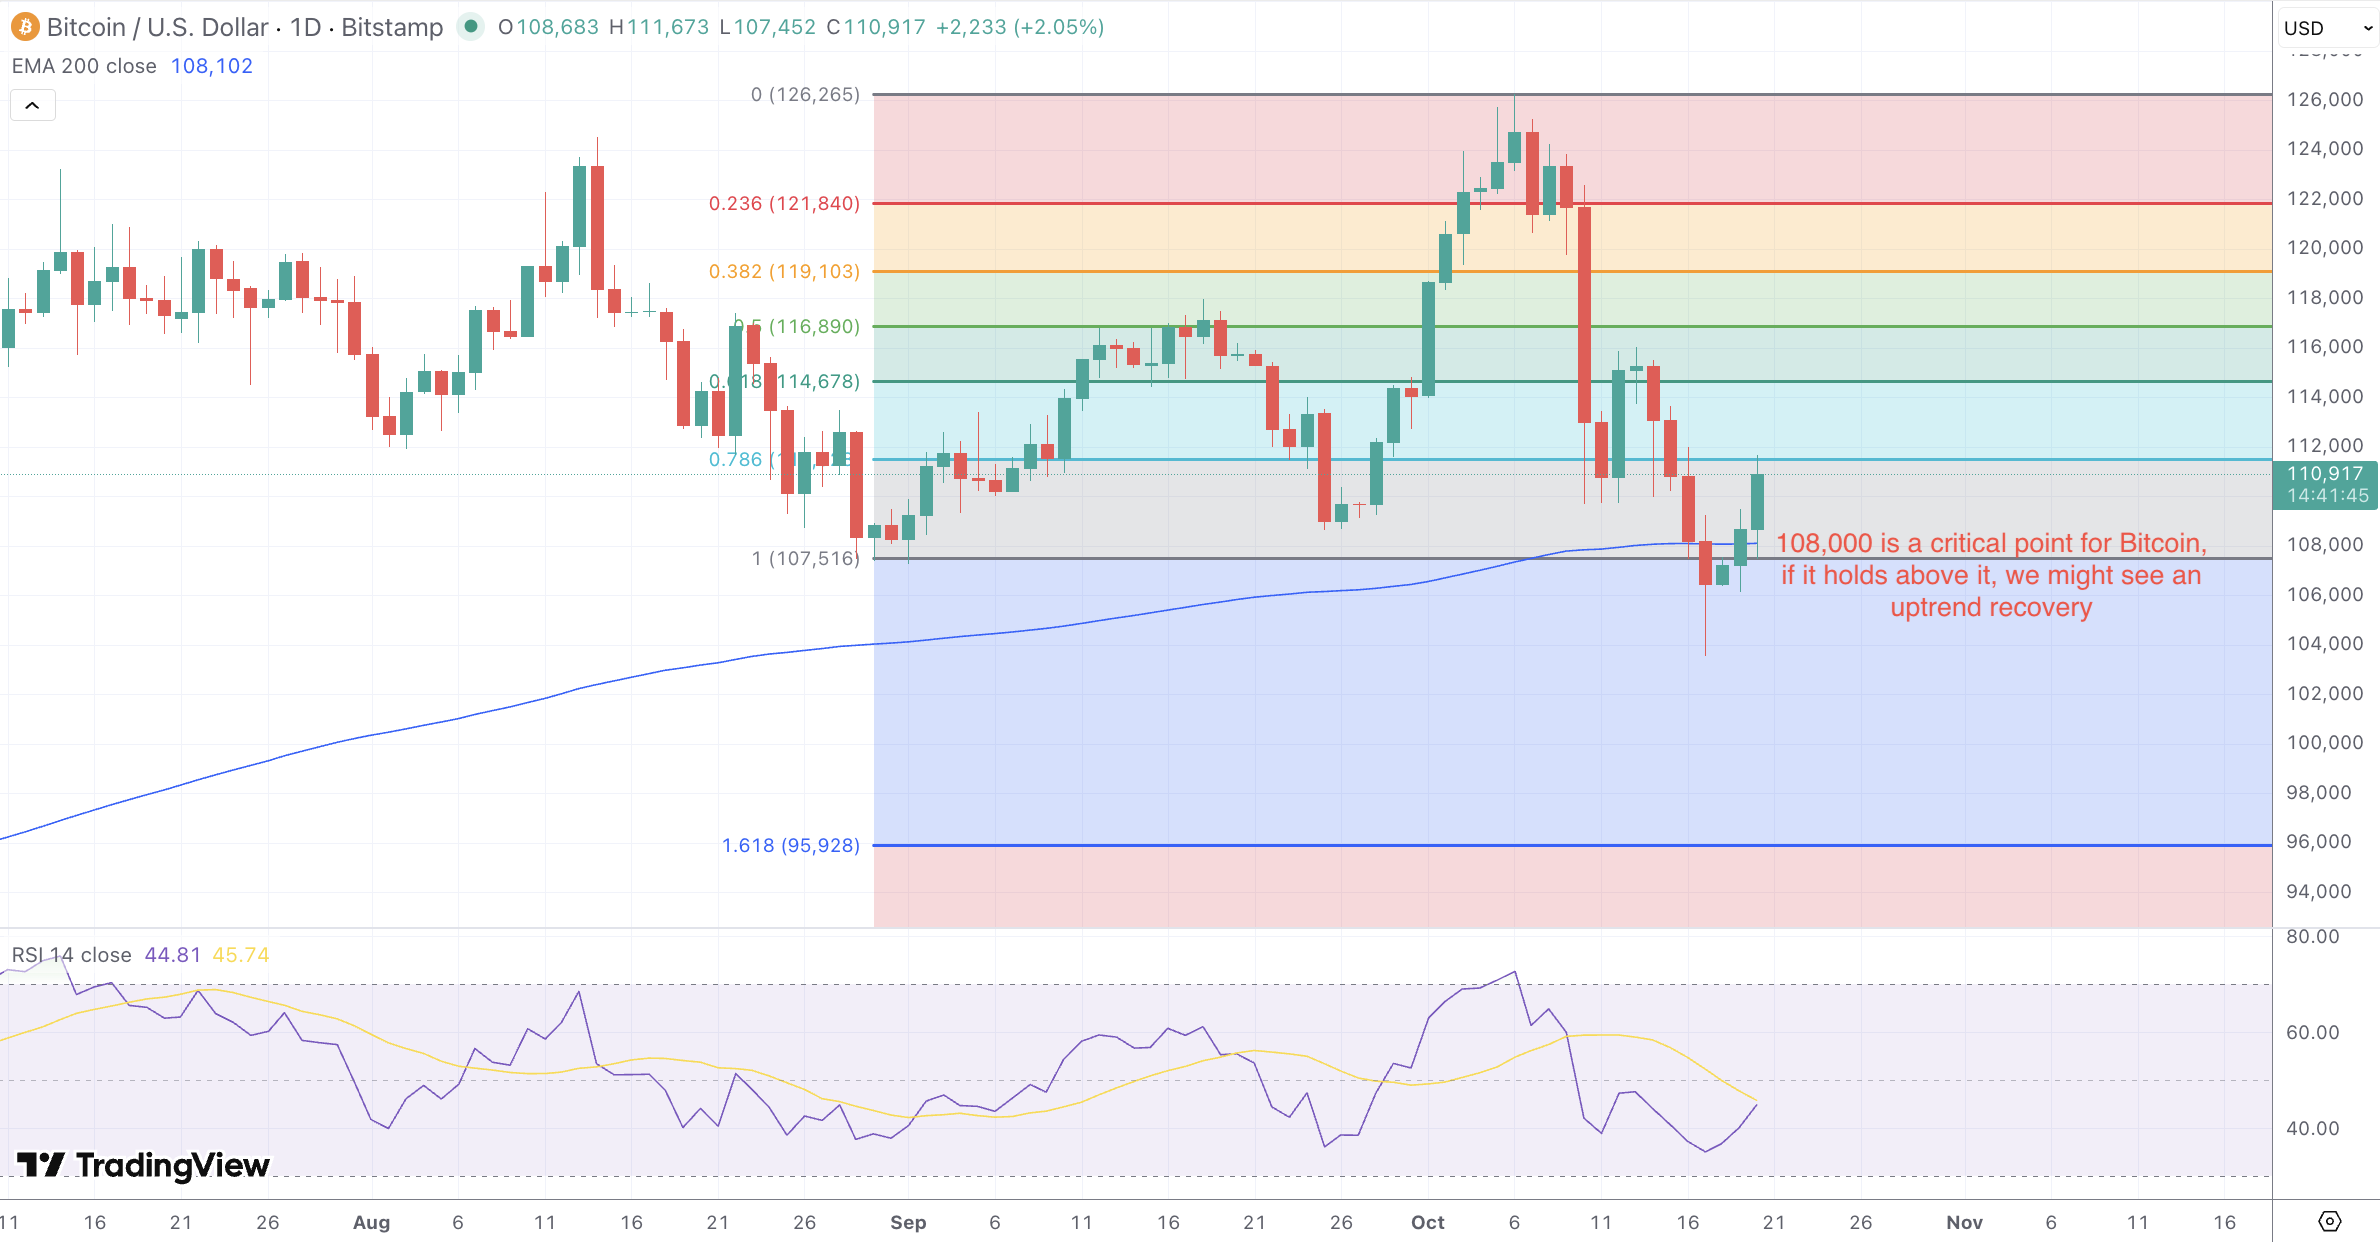
From a technical standpoint, Bitcoin finds itself at a constructive juncture. The cryptocurrency currently trades above the 200-day Exponential Moving Average around $106,000-$108,000, which veteran analyst Lark Davis characterizes as the bull-bear dividing line. This successful defense of critical support validates accumulation patterns and positions the asset for a potential relief rally. The immediate challenge is reclaiming the $112,000-$114,000 resistance zone, while maintaining the floor above $108,000 remains essential.
Immediate support clusters at $108,000, $106,548, and $105,967, with the 200-day EMA zone around $106,000-$108,000 providing a critical floor. The psychological $100,000 level lurks further below as ultimate support. On the upside, immediate resistance materializes at $112,000, followed by the 20-day MA at $116,541, and the critical EMA cluster between $114,000-$115,000 representing the key barrier for bulls. A decisive breakout above $115,000 would confirm renewed bullish structure and potentially open the path toward retesting the $118,000-$120,000 zone.
Key Takeaways
- Current Price Action: Bitcoin trades at $111,121, down 11.9% from October 6 all-time high of $126,198; holding above critical 200-day EMA support at $106,000-$108,000 in a positive sign for bulls
- Technical Levels: Immediate support at $108,000, $106,548, $105,967; critical 200-day EMA floor at $106,000-$108,000; resistance at $112,000, $114,000-$115,000 EMA cluster, and 20-day MA at $116,541
- Chart Patterns: Double-bottom formation with neckline at $117,300 projects $127,500 target; symmetrical triangle suggests imminent volatility expansion; current price above $108,000 support maintains bullish structure
- Momentum Indicators: RSI at 36.80 (neutral, recovering from oversold); MACD flattening suggests building buying pressure; trading between 200-day EMA support ($108,000) and 20-day MA resistance ($116,541)
- ETF Flows: Early October saw record $3.24 billion weekly inflows; reversed to $530.9 million outflow October 16; BlackRock’s IBIT dominates with $88 billion AUM; CME futures surpass Binance at $16.67 billion
- On-Chain Metrics: Long-term holder SOPR at 2.32 (132% average profit); exchange reserves at 6-year lows; accumulation by 1-1,000 BTC holders continues despite correction
- Fed Policy: October 28-29 FOMC meeting expected to deliver 25bp cut; Powell’s dovish stance supports risk assets; October 24 CPI report critical for policy expectations
- Week Ahead Catalysts: CPI data October 24; Fed/ECB meetings October 28-30; historical Q4 seasonality favors Bitcoin with 80% average returns since 2013
Bitcoin trades near $111,121 as of October 20, consolidating after a sharp correction from its all-time high of $126,198 reached on October 6. The flagship cryptocurrency has successfully defended critical support levels and now trades above the key 200-day EMA, suggesting buyers remain engaged despite recent profit-taking and shifting institutional sentiment. While long-term holders realize substantial gains and ETF flows turn volatile, technical indicators suggest the market is coiling for its next major move.
Market Dynamics and Recent Performance
Bitcoin’s price action has been turbulent throughout October, declining approximately 11.9% from its peak above $126,000 to current levels around $111,000. The cryptocurrency surged to record highs in early October fueled by massive institutional ETF inflows exceeding $3.24 billion during the first week alone, with BlackRock’s IBIT attracting nearly $1 billion in a single session on October 7. Subsequent profit-taking pushed prices lower, though Bitcoin has stabilized above the critical 200-day EMA, demonstrating resilient demand. ETF flows turned volatile mid-month, with a substantial $530.9 million outflow recorded on October 16, yet the successful defense of key support suggests institutional conviction remains intact.
On-chain data reveals strong accumulation by smaller holders (1-1,000 BTC) despite the price decline, suggesting institutional and retail investors view current levels as attractive entry points. The Spent Output Profit Ratio for long-term holders hit 2.32, indicating average realized gains of 132%, yet shorter-term metrics suggest selling pressure may be easing. CME Bitcoin futures open interest surpassed Binance’s for the first time at $16.67 billion, signaling growing institutional preference for regulated venues and enhancing Bitcoin’s credibility as a mainstream asset.
Technical and Fundamental Influences
From a technical standpoint, Bitcoin finds itself at a constructive juncture. The cryptocurrency currently trades above the 200-day Exponential Moving Average around $106,000-$108,000, which veteran analyst Lark Davis characterizes as the bull-bear dividing line. This successful defense of critical support validates accumulation patterns and positions the asset for a potential relief rally. The immediate challenge is reclaiming the $112,000-$114,000 resistance zone, while maintaining the floor above $108,000 remains essential.
Immediate support clusters at $108,000, $106,548, and $105,967, with the 200-day EMA zone around $106,000-$108,000 providing a critical floor. The psychological $100,000 level lurks further below as ultimate support. On the upside, immediate resistance materializes at $112,000, followed by the 20-day MA at $116,541, and the critical EMA cluster between $114,000-$115,000 representing the key barrier for bulls. A decisive breakout above $115,000 would confirm renewed bullish structure and potentially open the path toward retesting the $118,000-$120,000 zone.
