
Key Takeaways
- EUR/USD is trading at 1.14454, posting fresh 2026 lows as the Middle East conflict fuels a sustained safe-haven bid for the US dollar
- The 14-day RSI sits at approximately 28-30, firmly in oversold territory, raising short-covering risk but not yet signalling a reversal
- The MACD is in negative territory with the histogram extending lower, confirming bearish momentum across daily and weekly timeframes
- All major moving averages from MA5 through MA200 are stacked above price, with 12 out of 12 sell signals registered on the daily chart
- The Fed is widely expected to hold rates at 3.5%-3.75% at its March 18 announcement, with first cut expectations now pushed as far as September
- The ECB has signalled a pause after cutting rates eight times in the past year, adding policy ambiguity that weighs on the euro
- Near-term support sits at 1.1400, with resistance clustered around 1.1500 and then 1.1650-1.1670
- Any de-escalation in Iran could trigger a sharp corrective bounce; sustained conflict keeps the bias firmly to the downside
Market Dynamics and Recent Performance
EUR/USD is trading at approximately $1.14331 as of March 16, 2026, with the medium-term trend having turned decisively bearish. The pair has shed roughly 600 pips from its recent peak above 1.20, a move that accelerated sharply over the past three weeks as geopolitical risk reshaped the currency landscape.
The euro came under sustained pressure as concerns about higher oil prices weighed on currencies most exposed to energy shortages, while the dollar benefited from a safe-haven bid following the escalation of the US-Israeli conflict with Iran. The eurozone’s status as a net energy importer placed it squarely in the crosshairs of this dynamic. Global investors began unwinding cross-border exposures, pushing money into safe-haven assets and punishing currencies tied to net energy-importing economies.
The euro did manage a brief reprieve, touching the $1.16318 area at one point before retreating, having hit a more than three-month low of $1.1505 in the prior session. That bounce was driven by hopes of a quicker-than-expected resolution to the Iran conflict. Trump’s comments that the war could end sooner than initially outlined were quickly offset by simultaneous warnings of further escalation should Iran disrupt oil flows through the Strait of Hormuz, with Iran’s Revolutionary Guards dismissing the remarks entirely. Rate-easing expectations from major central banks have been pared back significantly, while money markets have increased bets on potential ECB rate hikes as early as this year.
Technical and Fundamental Influences
The chart tells a clear story. The pair has broken below a series of previously reliable support levels, most notably the 1.1628-1.1650 Target Zone that had contained price action in recent weeks. That break confirmed the shift to a short-term downtrend.
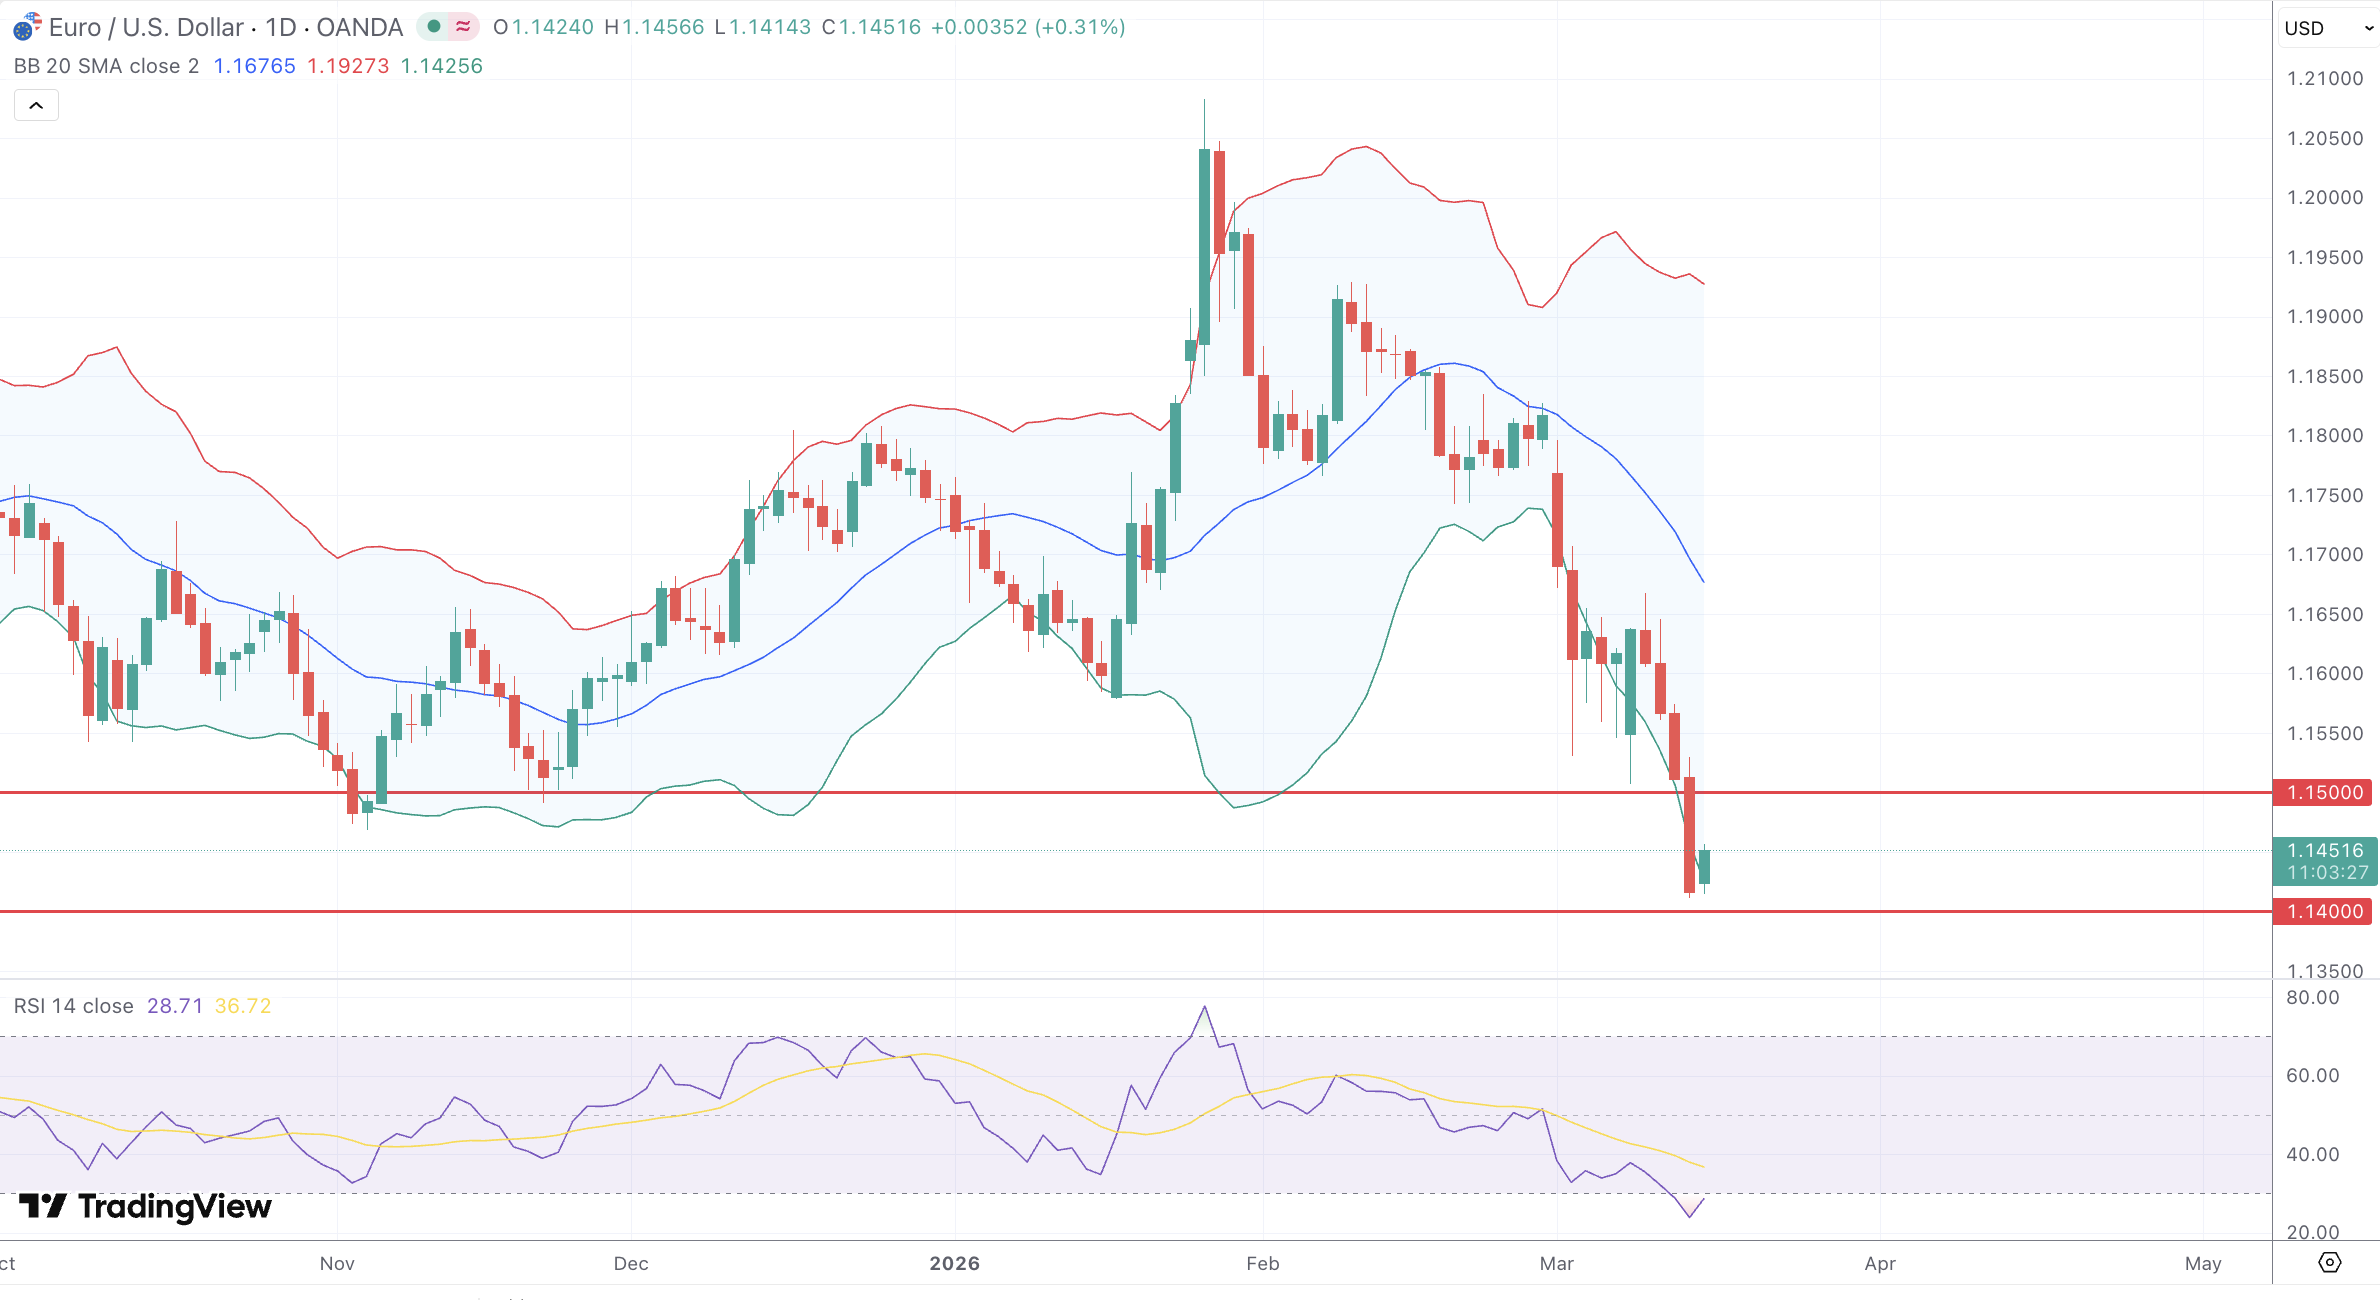
The 14-day RSI sits at approximately 28.28, firmly in oversold territory. The MACD registers a negative reading, and the 5-day moving average at 1.1425 alongside the 50-day moving average at 1.1504 both confirm sell signals. Across all moving averages from MA5 through MA200, every single one is pointing lower with zero buy signals registered on the daily timeframe. Price is pressing against the lower Bollinger Band, indicating persistent selling pressure and compressed volatility rather than a clean oversold bounce setup. The RSI approaching 30 does flag the risk of short-covering spikes within this declining structure. Immediate resistance sits at 1.1500, followed by the higher resistance zone at 1.1670 near the descending longer-term averages. On the downside, 1.1400 is the next key support, with a break lower opening the path toward 1.1350.
On the fundamental side, the Federal Reserve is widely expected to hold the funds rate steady at 3.5%-3.75% at its March 17-18 meeting. The FOMC will release its Summary of Economic Projections on March 18, providing a blueprint for how officials are interpreting the Iran conflict’s effects on inflation. Economists have dramatically adjusted their forecasts in recent weeks, with some now questioning whether the Fed will cut rates at all in 2026. Rate futures have reduced the anticipated magnitude of cuts this year to roughly 40 basis points, down from nearly 60 basis points before the Middle East conflict began.
The ECB, for its part, cut interest rates for the eighth time in the past year but has clearly signalled a pause ahead, with President Christine Lagarde indicating the central bank is now in a strong position to manage prevailing uncertainties. That hawkish tone could limit euro losses at the margin but is unlikely to produce a meaningful reversal on its own. The ECB meeting on March 19 also looks like a hold, though markets have begun pricing in the possibility of a rate hike later this year if sustained energy disruption pushes consumer prices materially higher.
The energy dependence angle remains the most structurally negative force for the euro. The comparison to March 2022 is instructive: when crude stayed bid above $100 per barrel for three months and natural gas prices tripled, the sustained rise in energy costs wrecked the terms of trade for the euro and ushered in a prolonged period of dollar strength. Whether history repeats depends almost entirely on how long the current conflict persists.
Looking Forward
The FOMC decision on March 18 dominates the calendar. The SEP dot plot will be scrutinised closely for any upward shift in the Fed’s inflation projections or a reduction in the expected number of cuts for the year. A dot plot showing fewer than two cuts in 2026 would almost certainly push EUR/USD toward 1.1400 and potentially below it.
The ECB meeting on March 19 adds another layer of volatility risk. A hawkish hold could offer the euro a brief reprieve, but the market would likely use any bounce as a selling opportunity rather than a reason to re-establish long positions. Barclays has already pushed its first Fed cut projection out to September, expecting a single quarter-point reduction for the entire year. In a prolonged conflict scenario with sustained energy disruptions, the euro could slide toward $1.10-$1.12. The more constructive case for the euro hinges entirely on a credible ceasefire or meaningful diplomatic progress between Washington and Tehran, which could produce a sharp and fast corrective rally of 150-200 pips.
For the week of March 16-21, the probable trading range sits between 1.1380 and 1.1550, with the bias tilted toward testing the lower end first. The oversold RSI suggests vulnerability to intraday short-covering spikes, but the structural environment of safe-haven dollar demand, a hawkish Fed hold, energy-import headwinds, and bearish moving average alignment all point to selling pressure reasserting itself on any meaningful bounce. Bulls would need a daily close back above 1.1500 to begin questioning the dominant short-term trend, and a close above 1.1670 to suggest the bearish phase is genuinely exhausted.