Key Takeaways
- Gold snapped a three‑day decline but remains below its 50‑ and 100‑period EMAs, with bearish momentum confirmed by a sub‑50 RSI and negative MACD.
- Immediate resistance clusters at $3,346 (trendline + moving averages) and $3,360–$3,374; key support lies at $3,310, then $3,303 and $3,283.
- The Federal Reserve’s forthcoming statement and U.S. economic data releases will be the primary drivers of gold’s near‑term trajectory.
- Broader market optimism from U.S.–EU and U.S.–China trade developments continues to cap safe‑haven demand, though any geopolitical flare‑ups could quickly shift the bias.
- Chinese gold demand shows a divergent pattern: total consumption down 3.5% year‑to‑date, but investment purchases up 24%, reflecting institutional hedging amid retail caution.
Market Dynamics and Recent Performance
Gold continues to face headwinds as improving global trade optimism and a firmer U.S. Dollar sap safe‑haven flows. After slipping to a fresh weekly trough of $3,312 in early Asian trade, bullion briefly rallied off the key $3,310 support, yet overall downside pressure remains evident. The U.S. Dollar Index has climbed in anticipation of the Federal Reserve’s upcoming policy decision, further weighing on non‑yielding assets as real yields rise.
Despite this, an easing of geopolitical tensions, from the unexpected U.S.–EU trade accord to the looming U.S.–China dialogue in Stockholm, has nudged risk sentiment higher, curbing gold’s traditional role as a crisis hedge. This tug‑of‑war between risk‑on optimism and rate‑driven headwinds set the stage for a choppy week ahead.
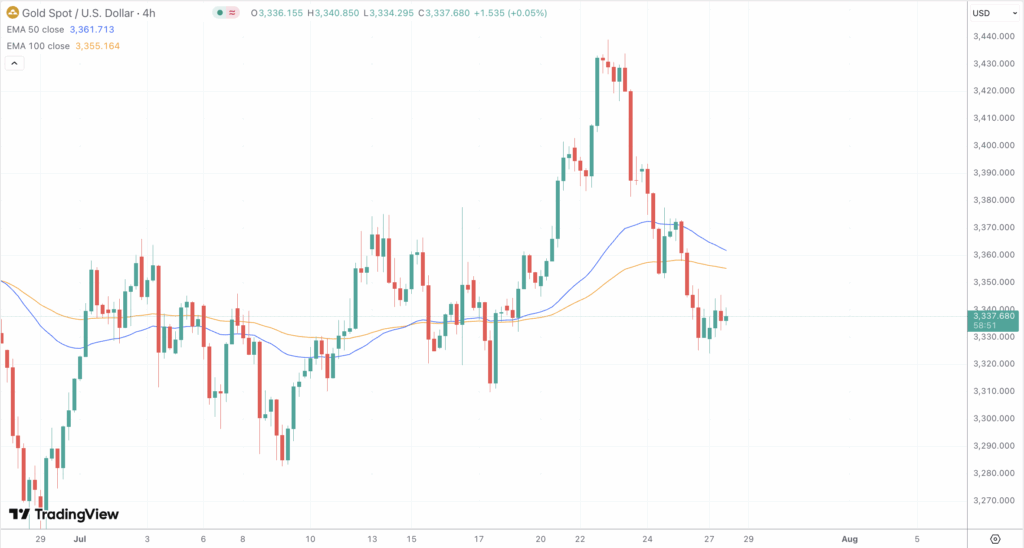
From a technical standpoint, gold’s breach of the crucial rising trendline at $3,342 and its close below both the 50‑period EMA ($3,361) and 100‑period EMA ($3,355) on the 4-hour chart, signal a shift to bearish momentum. The 14‑day RSI languishes just under the neutral 50 mark, hovering near 49, while the MACD histogram has flipped negative, with the MACD line sitting below its signal, underscoring diminishing upside conviction. Intraday traders will watch the $3,346 zone, where the 21‑day SMA, 50‑day SMA, and trendline resistance converge; a daily close above this confluence could arrest further declines.
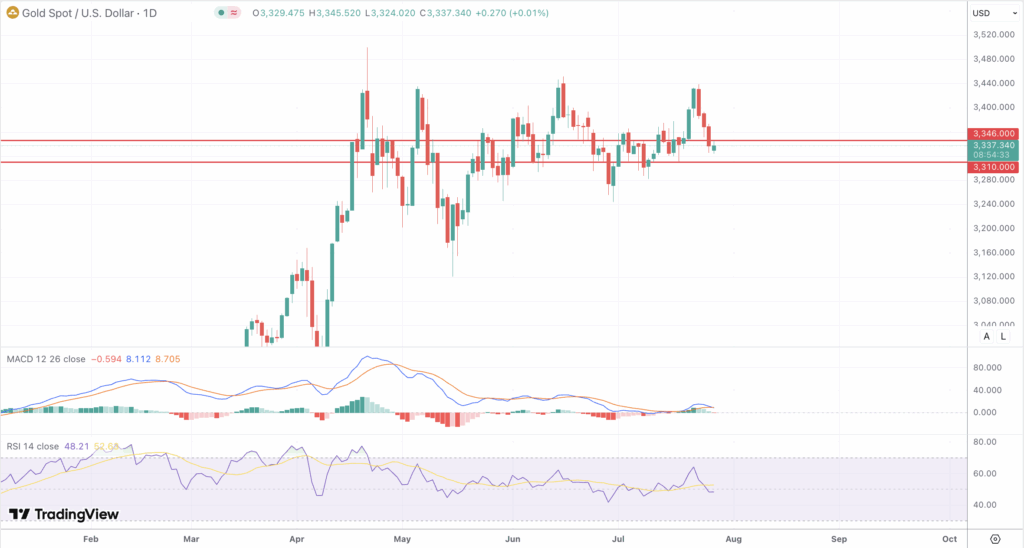
On the downside, a decisive drop below $3,310 would expose the July 9 low at $3,283, with secondary support at the June 30 trough of $3,303. Conversely, any relief rally might target $3,360 initially, before testing the $3,374–$3,380 supply area, where sellers have previously emerged.
Fundamentally, the Fed’s anticipated rate hold, and any accompanying forward guidance, will be pivotal. Higher‑for‑longer rate expectations have already pushed real yields upwards, penalizing gold. Meanwhile, mixed Chinese demand figures, overall consumption down 3.5% in H1 2025, with jewelry falling 26% but investment demand up 24%, underline a split between retail aversion and institutional hedging.
Looking Forward
Over the coming week, focus will center on the Fed’s policy statement and the raft of U.S. economic data, including the second‑quarter GDP release and labor market reports, that could reshape rate expectations. Should commentary remain hawkish, expect gold to gravitate toward the lower tier of the $3,283–$3,310 range. However, any unexpected dovish tilt or a pullback in the U.S. Dollar could spark a rebound into the $3,360–$3,374 band.
Risk factors abound: broadening trade‑deal reprieves may continue to cap upside, yet any flare‑up in geopolitical discord or a surprise slowdown in U.S. economic indicators could rekindle demand for bullion. Technical breaks in either direction will likely accelerate moves, making support and resistance thresholds at $3,346, $3,360, $3,283, and $3,374 critical inflection points.