
Key Takeaways
- Resistance is stacked at 112k to 115k, then 117k and 120k, with 123k as a stretch target if momentum expands.
- First support sits at 110k to 109k, then 107k, with a stronger floor at 103k to 101k near the 200-day average.
- 14-day RSI is mid-40s and 14-day ATR is near 3.3k, pointing to contained but event-sensitive volatility.
- ETF flows flipped negative late last week, which capped rallies below 113k. Watch for a turn back to inflows.
- Thursday’s CPI and the September 17 FOMC are the week’s macro engines. A cooler CPI strengthens the case for 115k to 120k.
Market Dynamics and Recent Performance
Bitcoin begins the week around 111k after a choppy early September that followed mid-August highs near 124k. The backdrop is macro heavy. After softer August jobs data, markets are leaning toward a Fed rate cut on September 17, with Thursday’s CPI at 08:30 ET setting the tone for risk assets and the dollar. Into this week, BTC held the 110k region while equities and gold wobbled, a sign that crypto is tracking rates and the greenback more than anything else.
Spot ETF flows turned mixed. Early September saw solid inflows, then Thursday and Friday flipped to net outflows of roughly 223m and 160m dollars, respectively, which helps explain why rallies stalled below 113k. Seasonally, September has been one of BTC’s softer months on average, so the market often requires a clear macro catalyst to break higher.
Technical and Fundamental Influences
The tape is constructive but hemmed in by well-defined levels. On the daily chart, the 20-day simple moving average sits near 113.6k, the 50-day near 114.5k, and the 200-day near 101k. That clusters resistance in the 112k to 115k zone and leaves a sturdier floor down at 103k to 101k. Momentum is neutral-to-improving, with 14-day RSI in the mid-40s, while realized daily volatility is contained, with 14-day ATR around 3.3k, or roughly 3 percent.
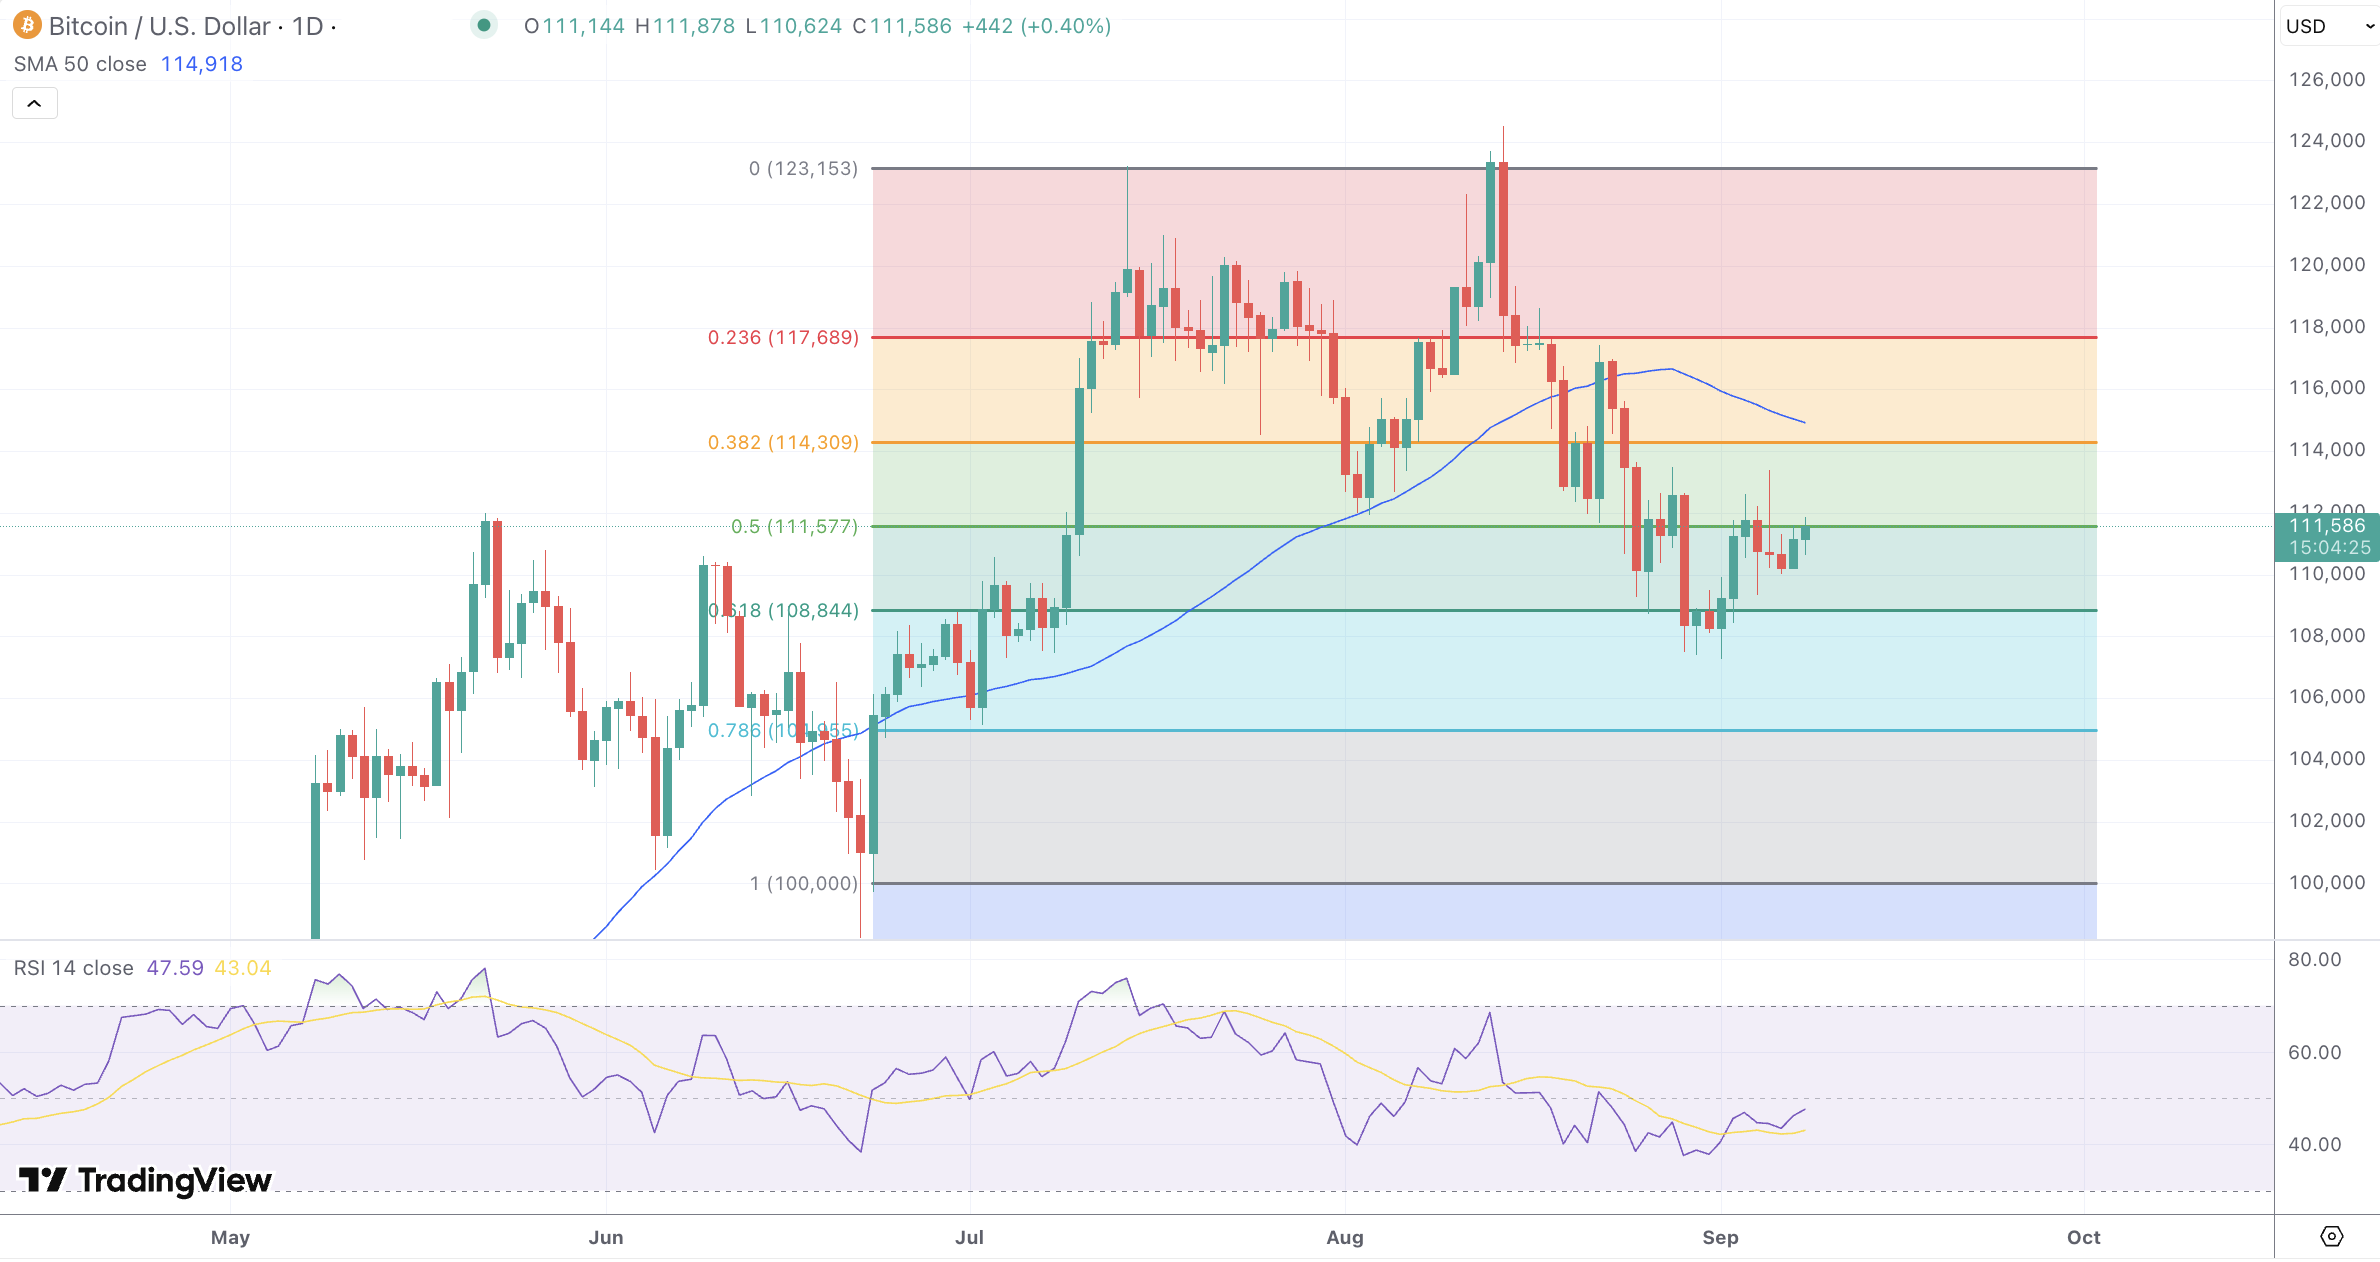
Short-term structure: last week’s range ran about 109k to 113k, and price keeps printing higher lows above 110k. A push through 115k would expose 117k first, then 120k and the August breakdown area near 123k. Lose 109k on a daily close and dip demand likely shifts toward 107k, then the 103k to 101k band near the 200-day.
Flows and macro still matter. ETF swings have been whipsawing intraday momentum, while CPI on Thursday and the September 17 FOMC will steer real yields and the dollar. On the supply side, the Mt. Gox distribution deadline was pushed to October 31, 2025, which limits near-term overhang but keeps a late-Q4 headline risk on the calendar.
Looking Forward
Base case for this week is a range with a topside bias as long as price holds above 110k to 109k. A benign CPI print would favor a break of 112k to 115k and a run at 117k to 120k. A hot CPI that lifts yields risks a fade back into 109k, then 107k, with only an outsized shock likely to test the 103k to 101k zone. Seasonality argues for patience in September, yet the combination of a rising 200-day and ongoing institutional participation argues that dips into support remain opportunities unless 101k gives way on volume.
