
Key Takeaways
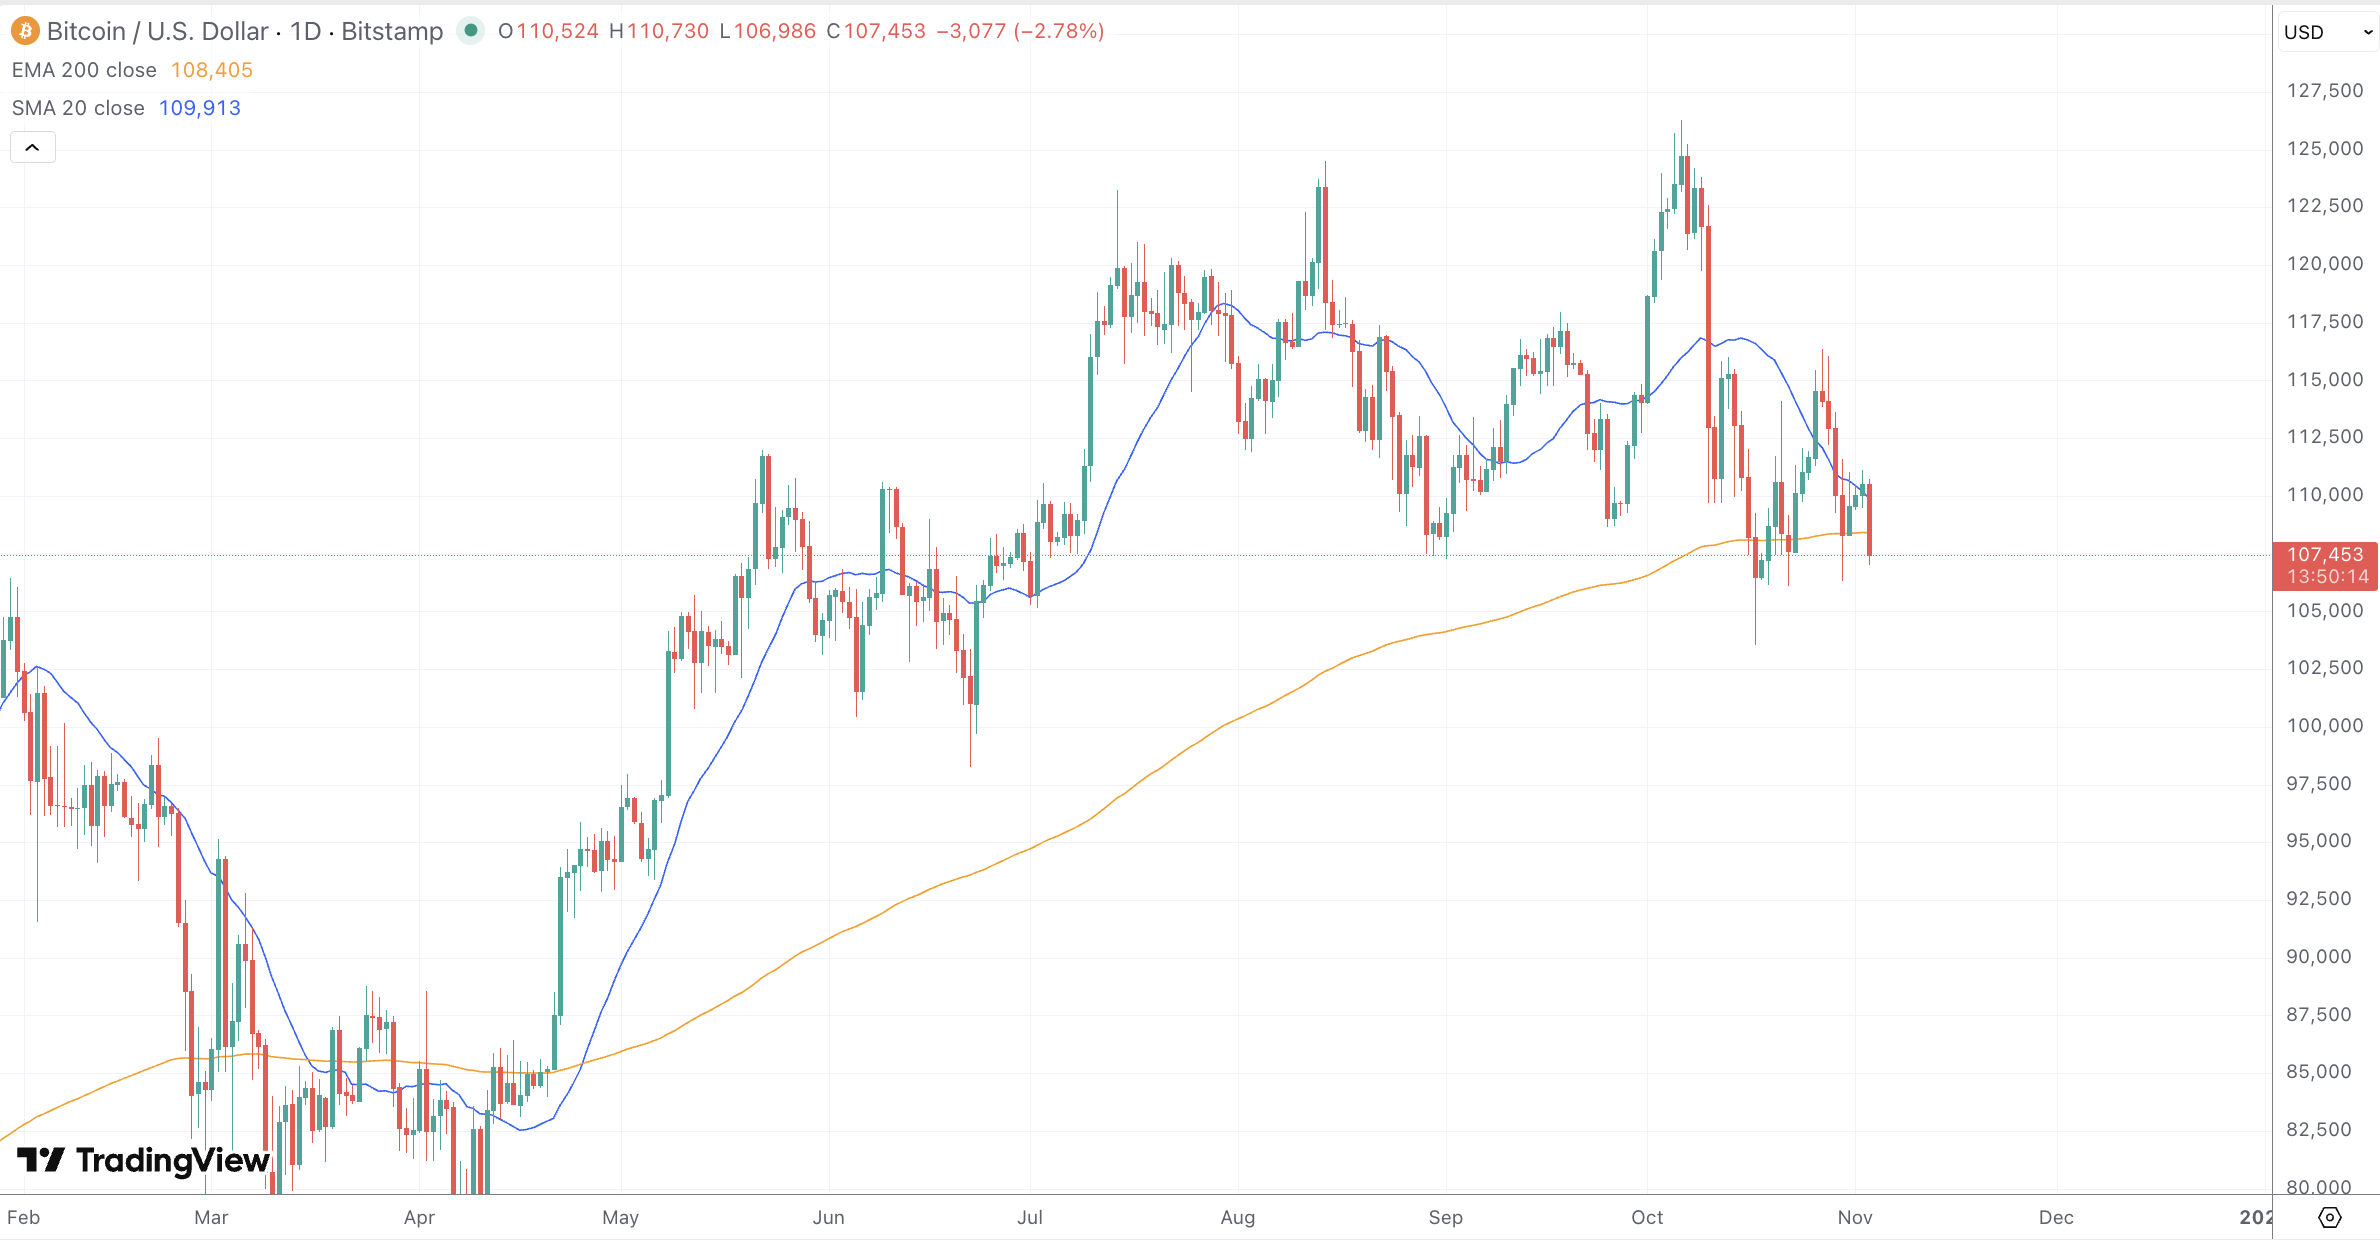
- Current Position: Bitcoin trades around $107,000 after declining 8.56% monthly from $126,296 all-time high, now below 200-day EMA
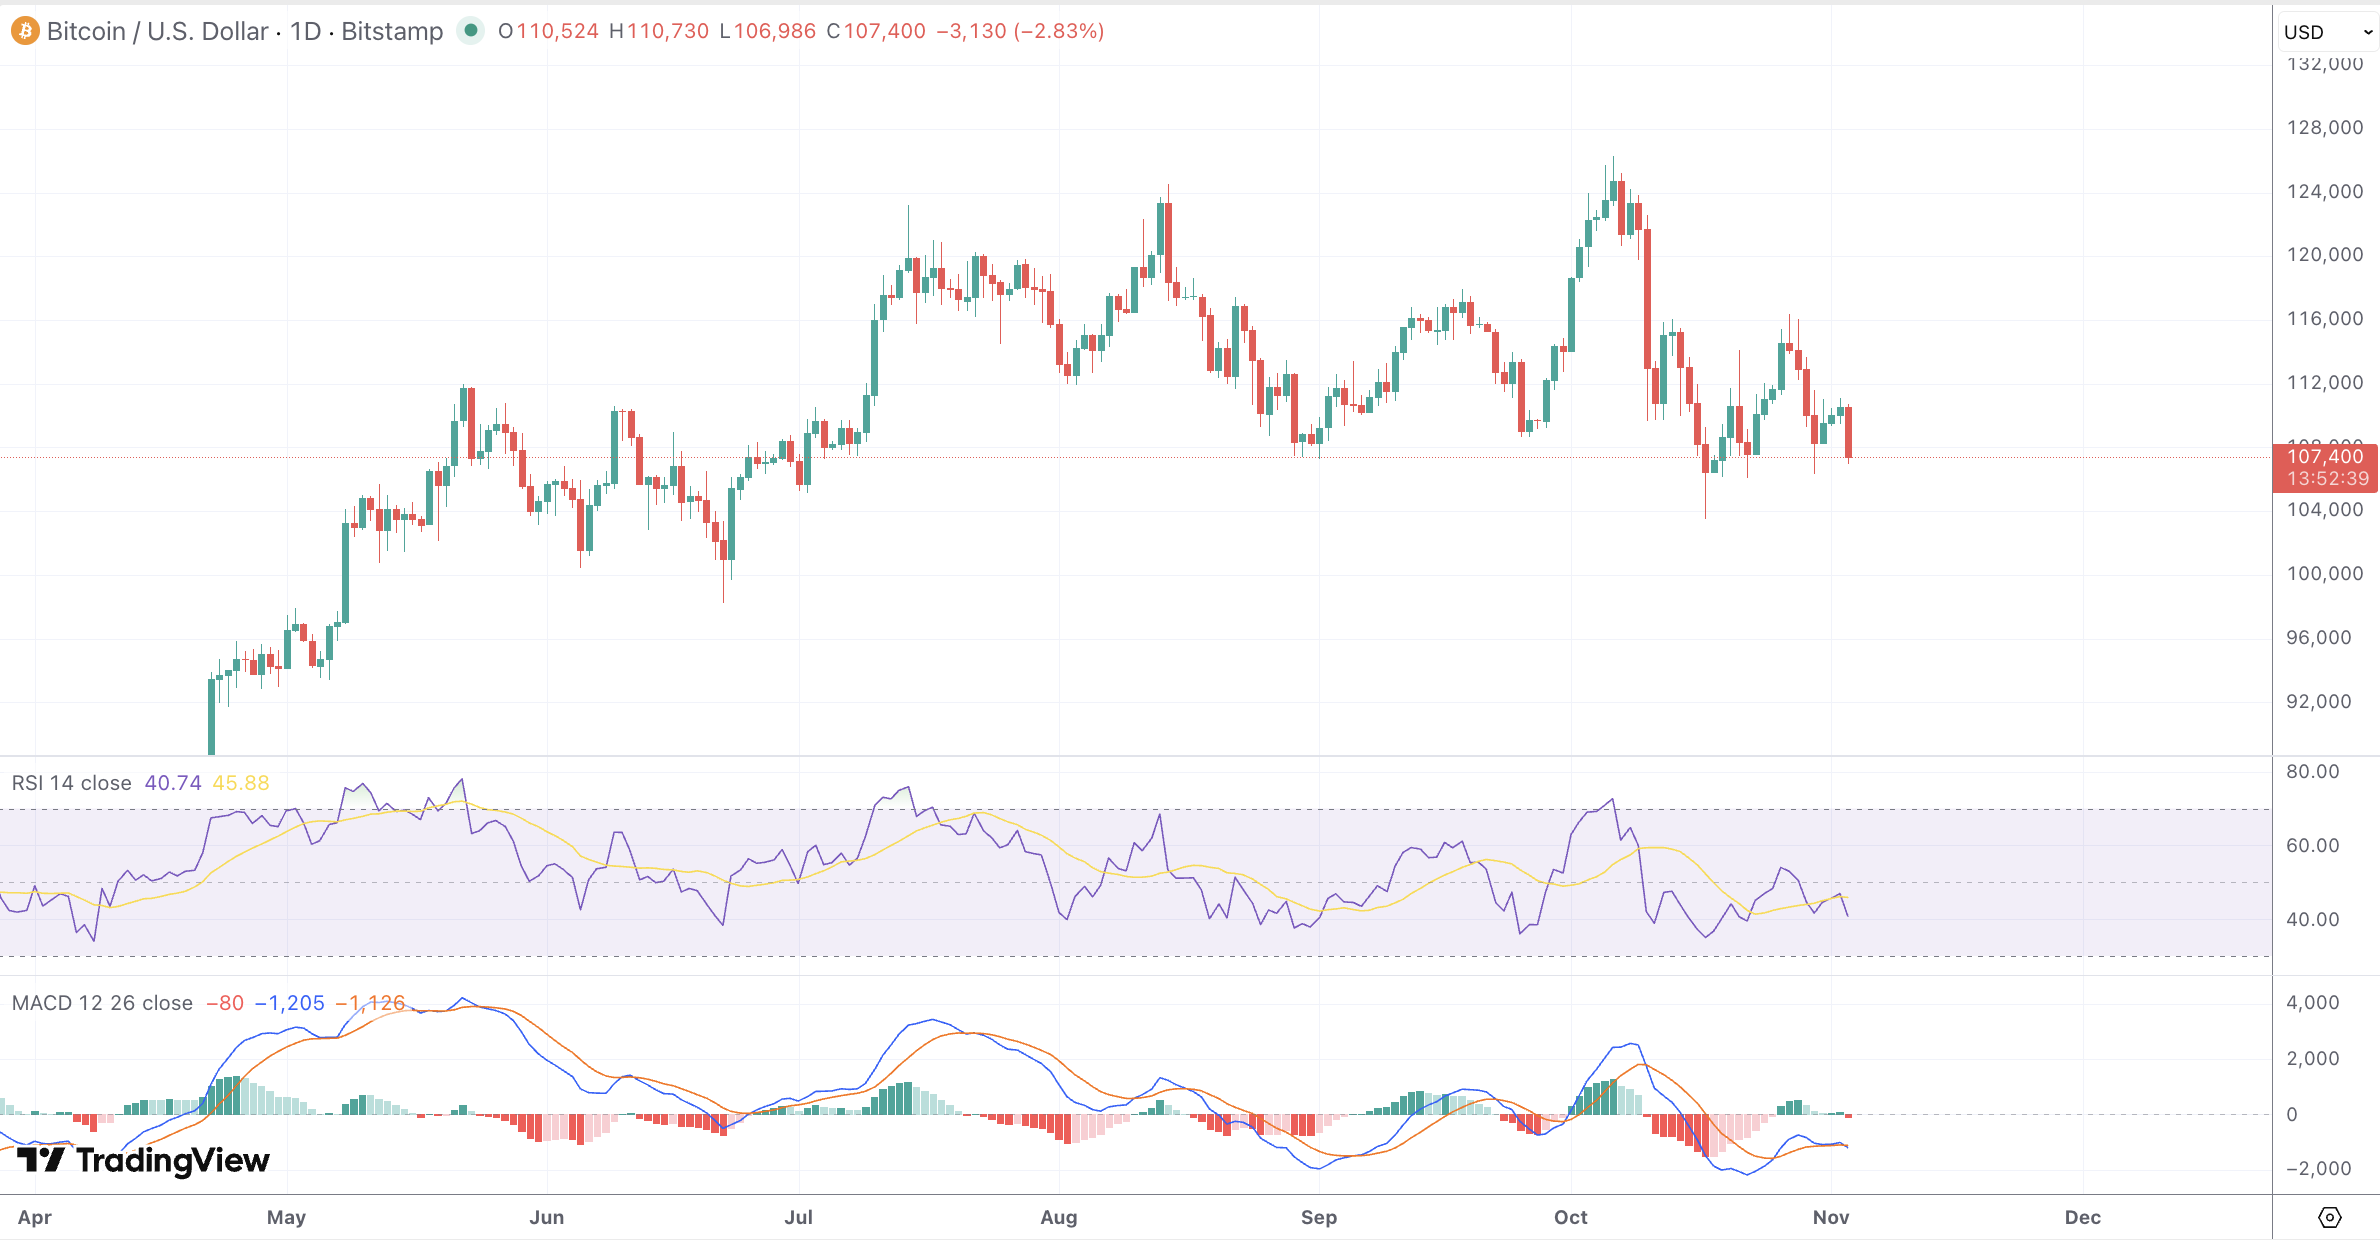
- Technical Outlook: Bearish signals with RSI at 42, price below key support, negative MACD though positive histogram suggests possible bounce
- Institutional Flows: $21.5B YTD ETF inflows with BlackRock’s IBIT holding $86B AUM, though recent $191.6M daily outflows show profit-taking
- Support Levels: Critical supports at $106,000, $103,528, and $100,000 psychological level as price tests lower bounds
- Resistance Zones: Former support at $108,350 (200-day EMA) now resistance, followed by $110,000 and $111,250
- Corporate Adoption: MicroStrategy holds 628,791 BTC ($70B), with 335 entities collectively holding 3.75M BTC representing 6.5% of supply
- Fed Policy Impact: 25-bp cut to 3.75-4.00% provides liquidity support, but hawkish Powell commentary limits December cut expectations
- Monthly Outlook: Historical November average of 42.49% gains challenged by current weakness, targeting $103,000-$116,000 range
Market Dynamics and Recent Performance
Bitcoin currently trades around $107,000, showing weakness after retreating from its all-time high of $126,296 reached in early October. The cryptocurrency has gained an impressive 58.46% over the past year but faces significant near-term pressure with an 8.56% decline over the past month. Price action has broken below the critical 200-day EMA near $108,350, testing the resolve of long-term holders and raising questions about the sustainability of the bullish structure.
The cryptocurrency produced remarkable gains throughout 2025, with net weekly gains recorded in 70% of trading weeks. However, recent sessions reveal accelerating selling pressure as Bitcoin trades below key moving averages. The breakdown below $108,000 has triggered stop-losses and created uncertainty about whether deeper support levels will hold. Volume patterns suggest institutional interest remains steady, though profit-taking following the October highs has intensified.
Technical and Fundamental Influences
Technical indicators present a bearish outlook in the short term. The Relative Strength Index currently sits at 42, indicating balanced momentum but with sellers maintaining control as price trades below key support levels. This RSI positioning suggests room for further downside before reaching oversold territory. The MACD shows a negative reading at -1,003, though the histogram has turned positive at 69, suggesting potential momentum shifts could develop if support levels hold.
Key resistance levels are now established at $108,350 (200-day EMA), $110,000 (psychological level), and $111,250, with the former support now acting as immediate overhead. The 20-day Simple Moving Average at $110,008 represents significant resistance that must be reclaimed to neutralize bearish momentum. The 50-day SMA at $113,678 remains a distant target requiring substantial buying pressure.
Critical support zones include $106,000, $103,528, and $100,000 (major psychological level). Current price action near $107,000 sits precariously close to the first support level. A break below $106,000 could accelerate selling toward $103,528, where stronger institutional buyers are expected to emerge. Further weakness below $100,000 would trigger substantial stop-losses and challenge the entire 2025 bull narrative. The daily Average True Range of $3,636 suggests traders should expect continued volatility.
Institutional adoption continues driving structural demand despite short-term volatility. Bitcoin ETFs attracted $21.5 billion in year-to-date inflows through October 2025, with Q3 alone contributing $7.8 billion. BlackRock’s IBIT ETF dominates with $86 billion in assets under management, capturing 48.5% of the Bitcoin ETF market. However, recent sessions saw mixed flows, with $191.6 million in daily outflows reflecting profit-taking after record inflows. ETFs now hold approximately 1.296 million BTC, representing 6.5% of total supply and creating structural upward pressure.
Corporate treasury adoption has accelerated significantly. MicroStrategy’s Bitcoin portfolio now exceeds 628,791 BTC valued over $70 billion, while 335 entities collectively hold 3.75 million BTC. This represents 6.2% of total supply held by corporations, a 21-fold increase since 2020. These strategic allocations as inflation hedges provide fundamental support independent of short-term price movements.
The Federal Reserve’s 25-basis-point rate cut in October to 3.75-4.00% initially boosted liquidity and risk appetite. However, Fed Chair Powell’s hawkish commentary tempering December cut expectations has created uncertainty. The reduced interest rate environment generally supports non-yielding assets like Bitcoin, though the Fed’s cautious stance limits immediate upside catalysts. Real rates remain elevated at approximately 1.25% with 2.5% inflation against 3.75% policy rates.
Bitcoin’s historical November performance provides optimism. Since 2013, Bitcoin has delivered an average 42.49% return in November, with gains recorded in 8 of 12 Novembers. This seasonal strength stems from year-end portfolio rebalancing, tax-loss harvesting completing, and institutional flows. However, 2025 introduces complexities including capital rotation toward alternative platforms like Solana, which attracted $199.2 million in ETF inflows during the same period Bitcoin saw outflows.
Looking Forward
The week ahead presents critical tests as Bitcoin trades below the 200-day EMA. A recovery above $108,350 is essential to restore bullish structure, with a confirmed reclaim of $110,000 needed to signal stabilization. Failure to recover could trigger accelerated selling toward $103,528 or the psychological $100,000 level.
Institutional flows remain decisive. Steady ETF inflows support the bull case, while the Fear & Greed Index at 33 reflects cautious sentiment. Tightening Bollinger Bands suggest imminent volatility expansion. For November, conservative targets project $103,000-$110,000 trading range, while recovery scenarios see $113,000-$116,000 if institutional buying accelerates and support levels hold.
