
Key Takeaways
- Bitcoin trades near $95,000 after falling 24% from October’s $126,000 all-time high, testing critical support amid record ETF outflows.
- November ETF redemptions reached $2.33 billion by mid-month, with BlackRock’s IBIT leading selling at $473 million daily.
- RSI at 37.4 (daily) and 41.8 (4-hour) approaches oversold territory, while MACD at -3,996 confirms deeply bearish momentum with negative histogram at -788.
- Key levels: Support at $94,000-$95,000 and $88,000-$90,000; Resistance at $99,000-$100,000 and $110,000-$116,400.
- Whale accumulation continues with 231 new wallets holding 10+ BTC created, while Harvard quadrupled holdings to $442 million.
- Fear and Greed Index at 17 signals extreme fear that historically marks local bottoms, with Bitcoin maintaining structure above 200-week SMA at $93,000.
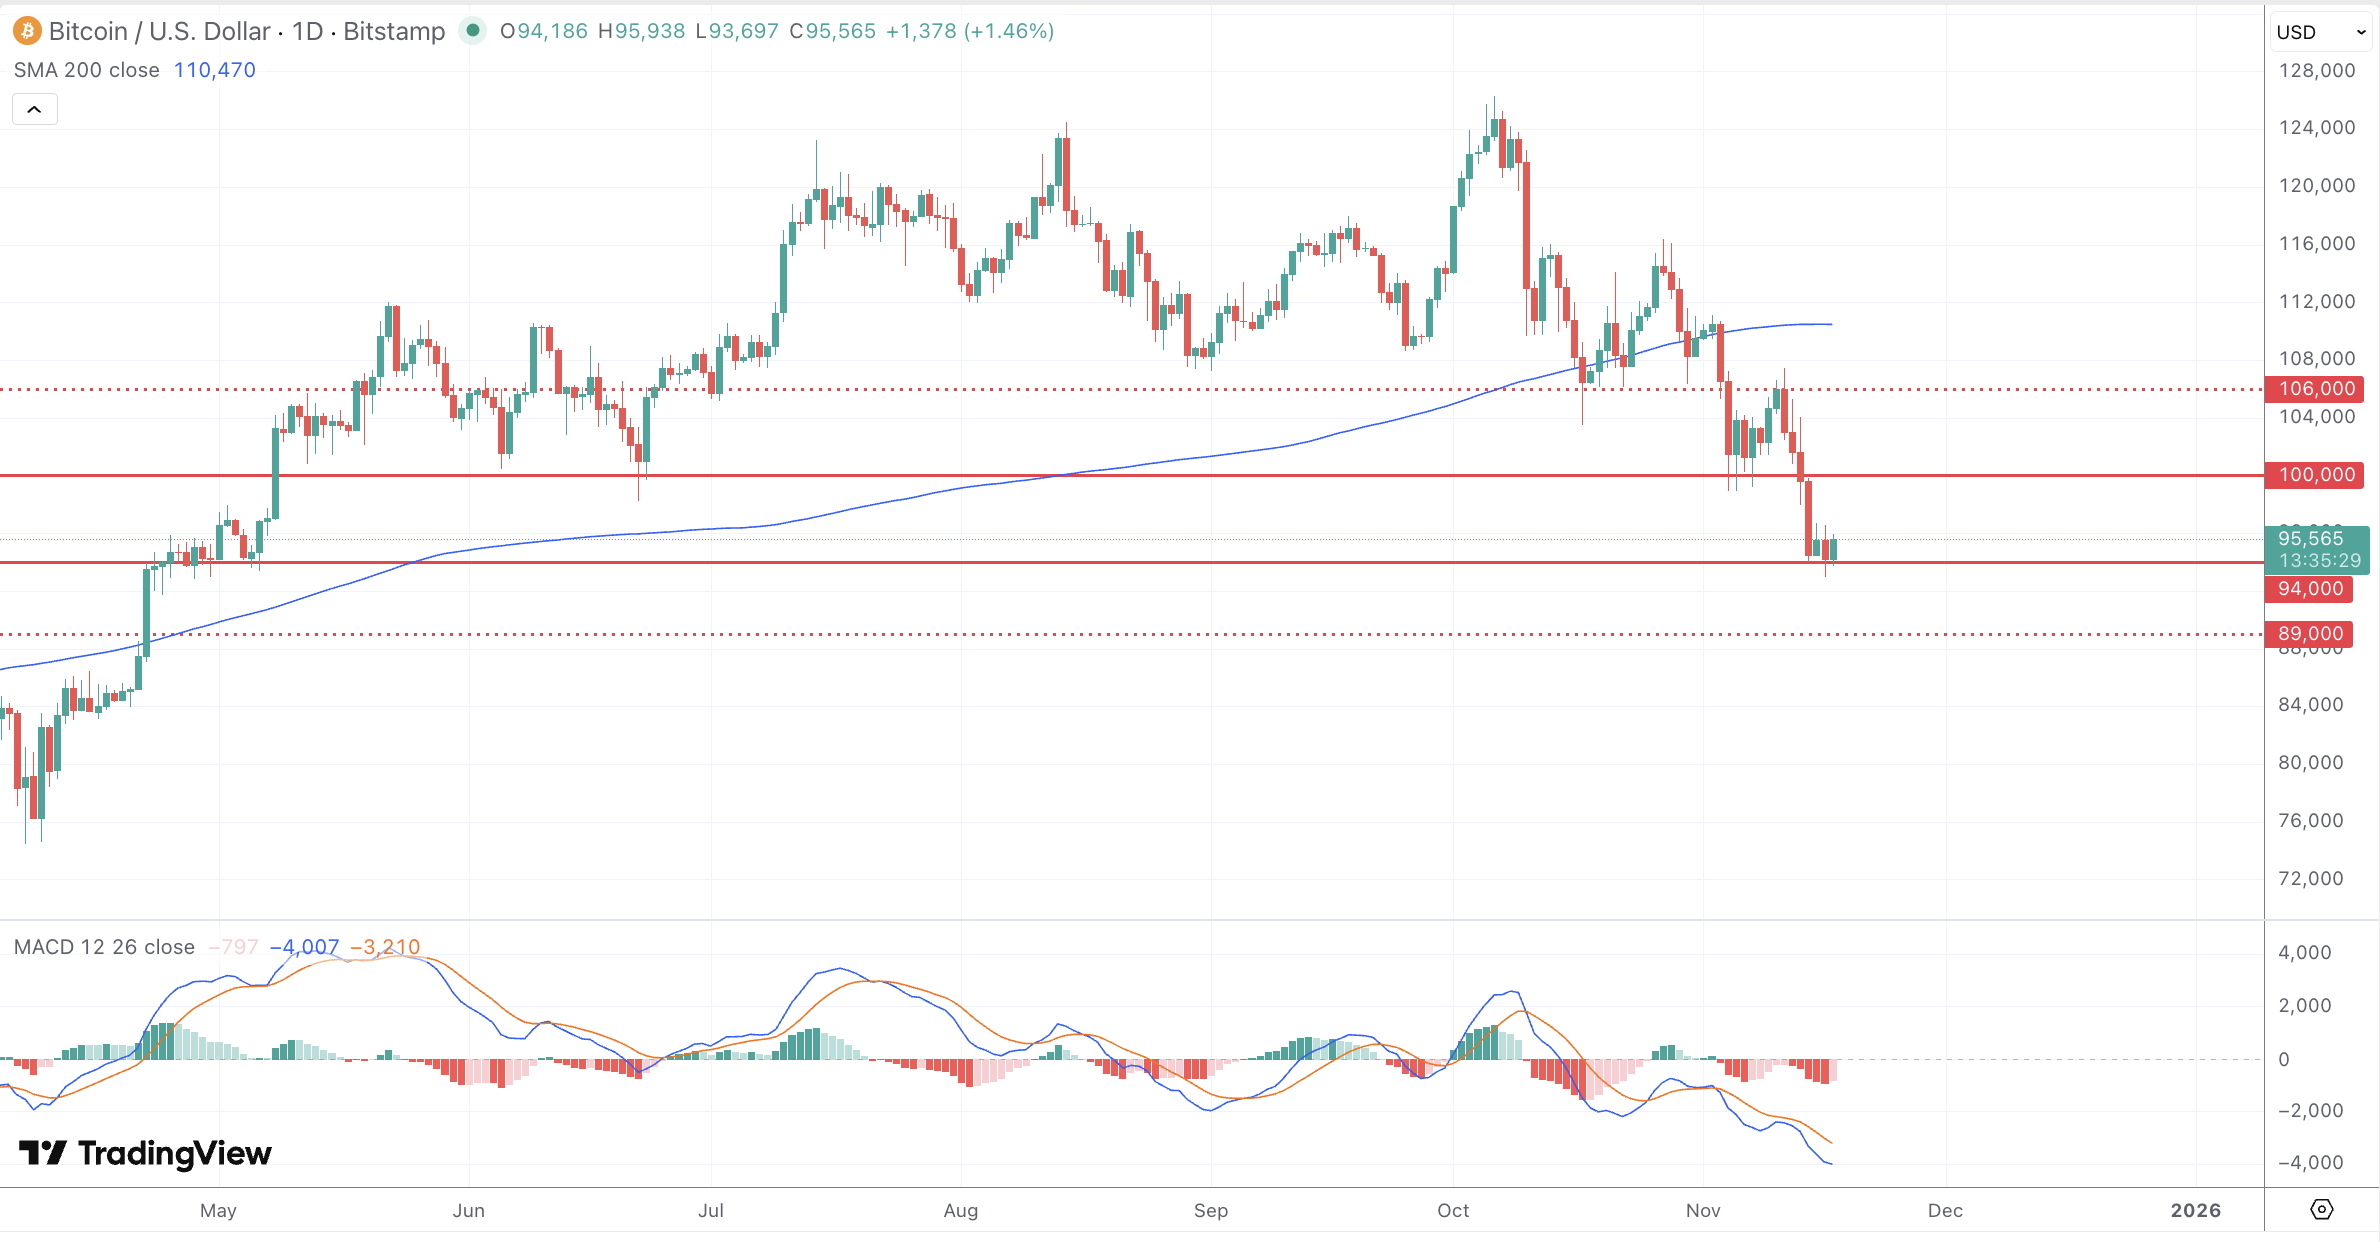
Bitcoin trades around $95,000 this week after retreating from its October all-time high near $126,000, facing pressure from record ETF outflows and shifting market sentiment. The cryptocurrency holds critical support levels while traders assess whether this represents a healthy correction within the broader bull market or signals deeper retracement ahead.
Market Dynamics and Recent Performance
BTC-USD has experienced significant volatility throughout November, declining approximately 24% from the October peak near $126,000. The cryptocurrency broke below $100,000 and continues consolidating in the $94,000-$96,000 range, representing one of the sharpest corrections since the 2025 bull run began.
November has recorded $2.33 billion in ETF outflows by mid-month, approaching February’s record $4 billion. BlackRock’s IBIT led selling with $473 million in single-day outflows. Despite this institutional selling, whale activity shows 231 new wallets holding 10+ BTC were created during the dip. Harvard University quadrupled its Bitcoin ETF holdings to $442 million in Q3, demonstrating long-term conviction despite short-term volatility.
The Fear and Greed Index plunged to 17, signaling extreme fear conditions that often mark local bottoms. Trading volumes remain elevated at approximately $74 billion daily, indicating active participation despite bearish price action.
Technical and Fundamental Influences
The 14-day Relative Strength Index shows bearish readings across timeframes: 37.4 on the daily chart and 41.8 on the 4-hour chart. Both readings approach oversold territory below 30, suggesting selling pressure remains intense but may be nearing exhaustion. The daily RSI at 37.4 indicates Bitcoin is closer to oversold conditions, often preceding relief bounces.
The MACD presents deeply bearish momentum with the indicator at -3,996 and the signal line at -3,208, creating a negative histogram of -788. This configuration confirms strong downside momentum with both lines in deeply negative territory. The widening gap between MACD lines suggests bearish pressure continues building, though extreme readings can precede reversals.
Resistance levels sit at $99,000-$100,000 (psychological level), $106,000-$108,000, and $110,000-$116,400 (prior consolidation). A decisive break above $110,000 would target $120,000-$126,000.
Support structures provide critical floors at $94,000-$95,000 (immediate support), $88,000-$90,000, and $80,000-$82,000 (major demand). Bitcoin trades below its 50-day SMA at $113,678 but maintains structure above the 200-week SMA near $93,000.
The fundamental backdrop shows improving regulatory clarity with pro-crypto initiatives and upcoming South Korean ETF approvals by mid-2026. Network activity and on-chain liquidity continue accelerating despite price weakness, forming conditions typically seen before major upside phases.
Looking Forward
Bitcoin must defend $94,000-$95,000 support to maintain bullish potential. A hold above this level with reduced ETF outflows could trigger short-covering toward $100,000. Bulls need to reclaim the six-figure mark to restore confidence and target $110,000-$116,000.
Failure to hold current support would accelerate selling toward $88,000-$90,000, where the 200-day SMA resides. Breakdown below $88,000 would challenge the intermediate-term structure and potentially trigger cascading losses toward $80,000.
The extreme fear reading of 17 historically correlates with local bottoms, as does RSI approaching oversold territory. Whale accumulation reinforces this bottoming narrative. ETF flow dynamics will determine near-term direction—any reversal in redemptions could rapidly shift sentiment.
Consolidation between $90,000 and $100,000 appears most likely this week. The path of least resistance remains bearish until bulls reclaim $100,000 decisively, though risk-reward favors patient buyers given the 24% discount from recent highs.
