
Key Takeaways
- BTC/USD is trading at $73,250, gaining 0.58% in Monday’s session with a daily range of $72,294-$74,425.
- The 52-week range spans $62,000 to $125,179; current price occupies the lower quarter.
- The 5-day EMA ($69,960), 50-day EMA ($70,884), and 200-day EMA ($70,269) are all below price for the first time since the Q4 2025 breakdown.
- RSI sits at 59 with daily MACD in bullish crossover; weekly MACD histogram remains negative, reflecting medium-term caution.
- Parabolic SAR has flipped bullish; OBV is rising; Bollinger Bands approaching the upper band in a post-compression context.
- The 23.6% Fibonacci retracement at $76,856 is the primary resistance target; $71,200 and $65,000 are the key support levels.
- The FOMC meeting on March 17-18 is the week’s dominant risk event; the dot plot and Powell’s commentary are the actual market movers, not the hold itself.
- A hawkish dot plot risks a $65,000 retest; a neutral hold risks a 3%-5% dip to $70,000-$72,000; a dovish surprise targets $80,000.
- Cumulative spot ETF inflows above $55 billion and returning positive daily flows provide structural support at current levels.
- A daily close below $69,400 signals recovery stalling; reclaiming $80,700 on a sustained basis is required to confirm a genuine trend reversal.
Market Dynamics and Recent Performance
Bitcoin enters the week of March 17 trading at $73,250, having printed a session open at $72,849, a high of $74,425, and a low of $72,294, for a gain of 0.58% on the day. The recovery from the February trough near $62,000 has been gradual but structurally significant, with price action forming a sequence of higher lows on the daily timeframe. Over the trailing seven days Bitcoin has advanced roughly 7.9%, clawing back meaningful ground after a drawdown that originated near $97,000 in late 2025.
The 52-week range extends from approximately $62,000 to $125,179, and the current price sits well into the lower quarter of that band. Total market capitalisation stands above $1.44 trillion, with 24-hour trading volume near $21.85 billion, indicating sufficient participation to absorb directional moves. Spot Bitcoin ETF flows returned to positive territory in the prior week, recording net inflows on consecutive sessions after a prolonged stretch of outflows, a meaningful shift in institutional sentiment ahead of a high-stakes macro week.
Technical and Fundamental Influences
The technical structure is best described as a contested recovery rather than a confirmed reversal. The 5-day EMA sits near $69,960, the 50-day EMA around $70,884, and the 200-day EMA at approximately $70,269. Price trading above all three simultaneously represents the first bullish EMA alignment Bitcoin has achieved since the deterioration began in late 2025, and a sustained close above this complex would reinforce the case for a more durable leg higher.
The 14-day RSI sits near 59, constructive without approaching overbought territory above 70. The daily MACD line has crossed above the signal line with histogram bars printing in positive territory, confirming near-term buying pressure. The weekly MACD histogram, however, continues to reflect underlying weakness, meaning the medium-term trend has not yet fully transitioned from bearish to neutral.
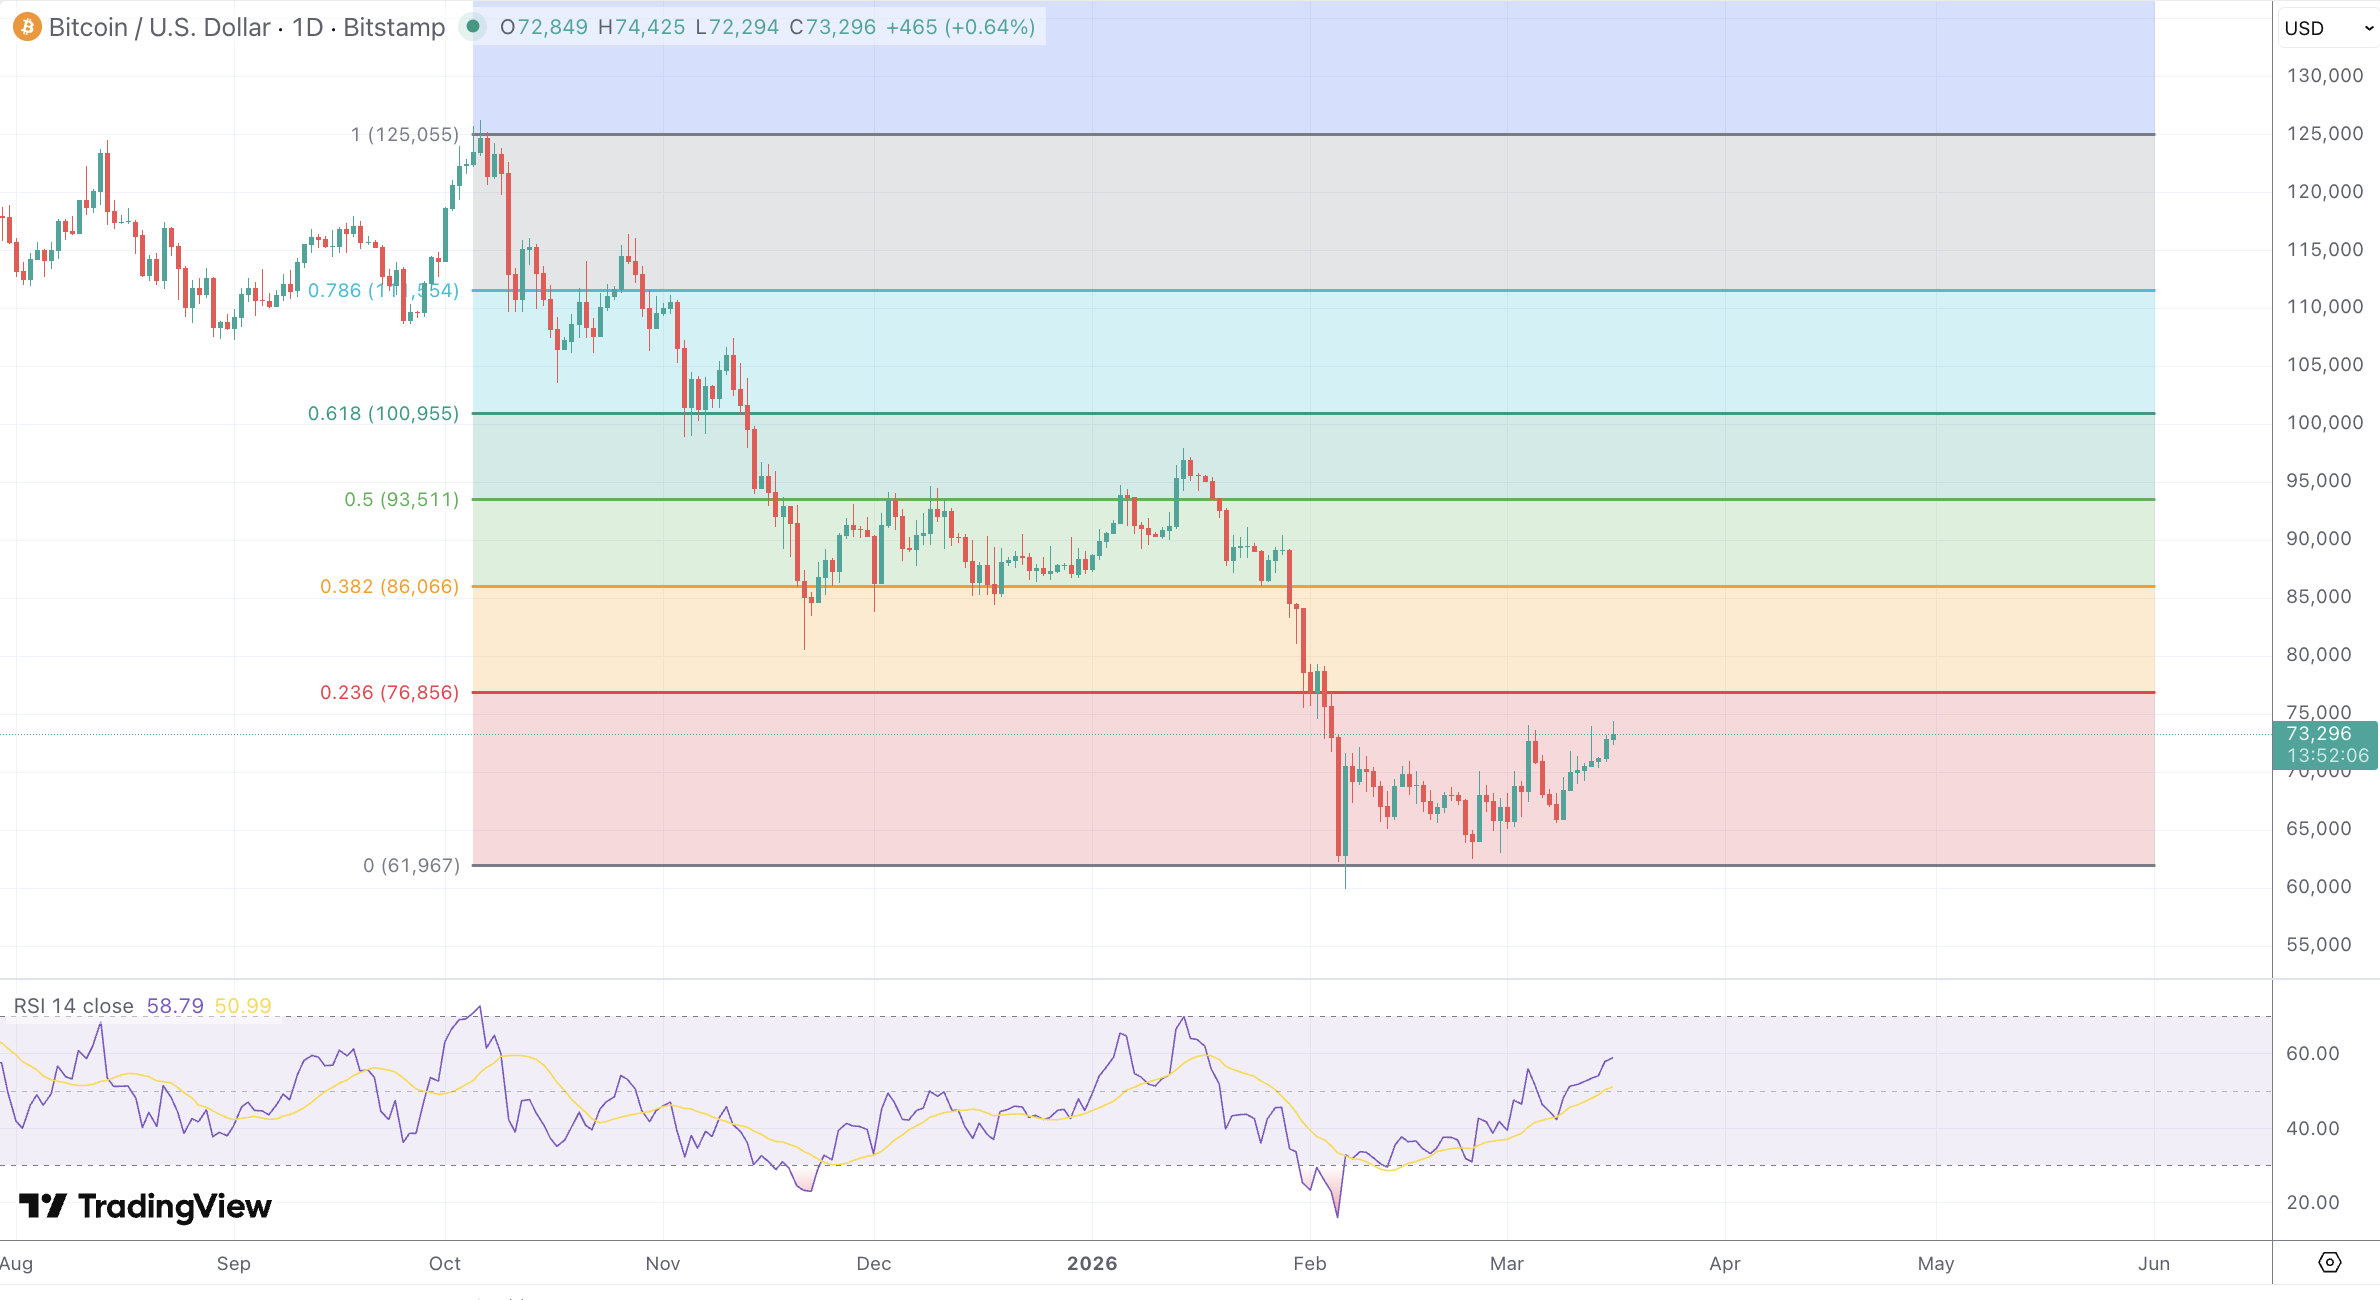
Fibonacci retracement analysis from the October 2025 high near $125,000 to the February 2026 low near $62,000 places the 23.6% level at $76,856, the first meaningful resistance hurdle for this week. The 38.2% retracement sits near $86,000 and the 61.8% near $101,000. On the downside, the 14.6% retracement near $71,200 is the immediate support reference; price holding above it on any pullback would preserve the recovery structure, while the principal floor remains at $65,000.
Parabolic SAR has recently flipped to a bullish orientation with dots printing below price, signalling a shift in trend momentum. ATR is running near $2,500 per day and the ADX is climbing from subdued levels, indicating directional conviction is building. Bollinger Bands show price approaching the upper band after extended compression, where a close above it would likely act as a continuation signal rather than a reversal warning. On-Balance Volume has trended upward over the past two weeks, corroborating the recovery with genuine accumulation, while bullish engulfing and hammer formations at the $65,000-$68,000 demand zone provided the candlestick foundation for the current advance.
The dominant fundamental event is the FOMC meeting on March 17-18. A hold at 3.50%-3.75% carries a probability above 94% and is already priced in; the genuine risk lies in the dot plot, updated for the first time incorporating Trump’s 15% global tariffs and the inflationary spike from U.S.-Israel strikes on Iran that briefly sent crude above $119 per barrel. The February CPI print of 2.4% predates those developments, and economists estimate headline CPI could reach 2.6%-2.9% for March.
Bitcoin has declined after seven of the eight FOMC meetings in 2025 via the sell-the-news mechanism, and the 48-72 hour post-announcement window is the week’s primary volatility inflection point. A neutral hold maintaining one 2026 cut would likely produce a 3%-5% dip toward $70,000-$72,000 before stabilisation; a hawkish revision to zero cuts is the bear case with $65,000 the next support; a dovish surprise of two or more cuts would target $80,000. Powell’s press conference language on tariff inflation will carry as much weight as the projections themselves. Geopolitical risk from the Middle East conflict and persistent tariff policy continue to suppress broader risk appetite, while cumulative ETF inflows exceeding $55 billion remain a structural support for the asset.
Looking Forward
Price action is likely to remain compressed ahead of the March 18 announcement, with the immediate range defined by $71,200 support and $74,425 resistance. A confirmed breakout above $74,425 on elevated post-FOMC volume would open the path toward the $76,856 Fibonacci level and the $80,000 psychological reference. A neutral Fed outcome producing the typical post-FOMC dip to $70,000-$72,000 should be treated as a support retest provided the EMA complex holds on a closing basis. The medium-term recovery thesis requires a sustained reclaim of $80,700 to confirm a structural trend shift; until that level is cleared, the current advance remains a corrective bounce within the broader downtrend. Traders should monitor the 48-hour post-FOMC window closely and treat any daily close below $69,400 as an early warning that the recovery is losing momentum.
