Key Takeaways
- Gold trades near $5,104, consolidating within an ascending channel after a 2.5% weekly loss and a failed breakout above $5,419 driven by the Iran conflict.
- Weekly RSI approaching 70 and the Parabolic SAR flipping bearish on the daily chart signal near-term caution; the ADX in the mid-20s confirms fading trend momentum.
- Support is concentrated in the $5,052 to $5,080 zone (38.2% Fibonacci, channel base); a break below $5,000 targets the 50-day EMA near $4,883.
- Resistance sits at $5,184 (61.8% Fibonacci), $5,266, and $5,343 to $5,400; a daily close above $5,184 reopens the bull case.
- Fed cut odds for June have slipped to 35%, with total 2026 easing at a year-low of 40 basis points as oil-driven inflation pressures mount.
- Tuesday’s February CPI is the week’s primary event risk, capable of resolving the current technical standoff in either direction.
Market Dynamics and Recent Performance
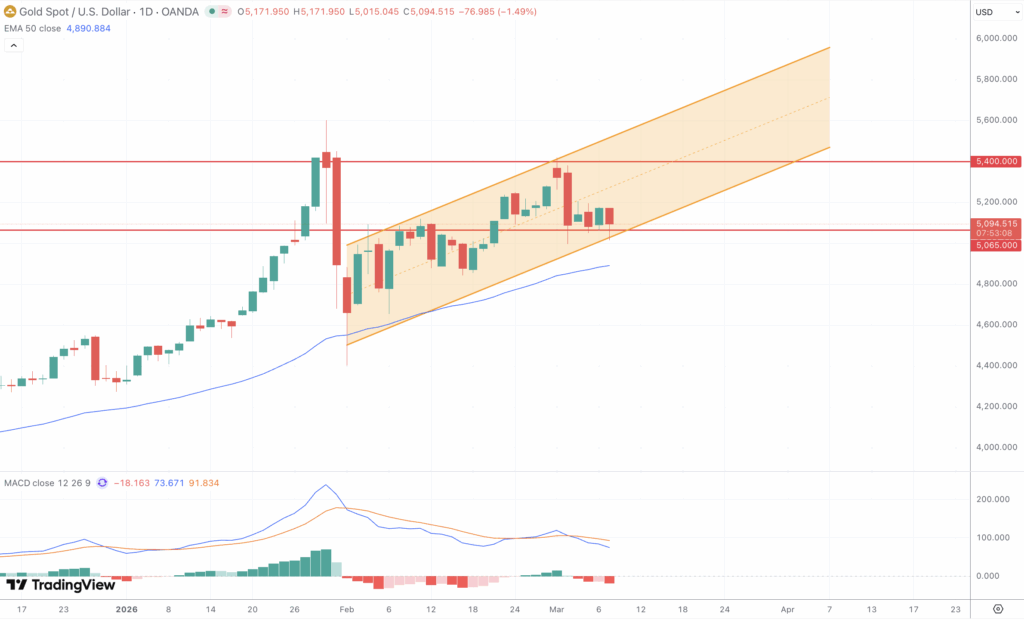
Gold enters the week of March 9 in turbulent consolidation, trading around $5,104 per ounce after one of the most geopolitically charged stretches in recent memory. The metal remains roughly 9% below its all-time high of $5,595 set on January 29, yet has still gained close to 19% year-to-date.
The defining event was the coordinated US-Israeli military campaign against Iran, launched on February 28, which briefly drove gold to an intraday high of $5,419. Buyers were unable to hold those levels, and XAU/USD snapped a four-week winning streak, closing roughly 2.5% lower, its largest weekly decline since the start of the year, with price dropping more than 5% from the weekly peak before stabilising.
The contradiction at the heart of gold’s behaviour is stark. Iran’s closure of the Strait of Hormuz triggered a supply-side inflation shock that drove the 10-year US Treasury yield to 4.11% over four consecutive sessions, while a strengthening dollar capped the metal’s safe-haven gains. February’s Non-Farm Payrolls compounded the picture, coming in at -92,000 against expectations of a 59,000 gain, pushing unemployment to 4.4%. The jobs miss briefly dragged the dollar lower and allowed gold to bounce off lows near $5,062, though the broader macro fog left any recovery measured.
Technical and Fundamental Influences
Gold is trading within a well-defined ascending channel on the daily chart, with the upper boundary near $5,400 serving as the rejection zone during the Iran spike and channel support running between $5,065 and $5,080. A break below that floor exposes the $5,000 psychological level, below which the 50-day EMA near $4,883 becomes the next key structural reference. The 5-day moving average at $5,157 sits marginally above spot, and the 200-day SMA at $4,232 confirms the dominant long-term uptrend remains intact.
The 14-period weekly RSI is approaching 70, its lowest reading of the year, a threshold bulls must defend to preserve the February rally structure. On the 4-hour chart, RSI has eased from above 80 at the Iran-spike peak to the mid-40s, a momentum normalisation that has left short-term conditions neutral. A bullish RSI divergence is developing in the $5,052 to $5,107 zone, offering some technical encouragement. The ADX in the mid-20s confirms a moderate and fading trend, and the Parabolic SAR has flipped above price on the daily chart, adding a tactical bearish signal for the near term.
Fibonacci retracement levels from the January high to the corrective low near $4,952 place the 38.2% level at $5,108 and the 61.8% level at $5,184. Gold is caught between these two references, which accounts for the choppy price action through early March. A Morning Star candlestick pattern is developing around the lower Fibonacci zone; confirmation would suggest buyers are returning and set up a push toward $5,343 and the $5,400 channel ceiling.
Fundamentally, two forces are in direct conflict. Safe-haven demand from the Iran conflict, disrupted physical bullion flows through Dubai, and persistent geopolitical uncertainty all underpin the structural bull case. Against this, the Fed rate-cut timeline has shifted. CME FedWatch now prices a June cut at roughly 35% probability, down from above 40% a week ago, with total 2026 easing at approximately 40 basis points by December, the lowest level of the year. Oil-driven inflation is the primary culprit, raising the spectre of stagflation and leaving the Fed with limited room to ease even as the labour market softens.
Looking Forward
The February CPI report, due Tuesday March 11, is the week’s most significant release. A hotter-than-expected print would further erode rate-cut expectations and pressure gold toward channel support, while a softer reading could support a move back toward $5,200 to $5,266. Thursday’s initial jobless claims and Friday’s Q4 2025 GDP second estimate round out a calendar that should sustain elevated volatility throughout the week.
Geopolitically, Iran denied reports that it had signalled a willingness to enter ceasefire talks, leaving the conflict’s duration uncertain. A credible de-escalation would unwind a portion of the war premium embedded in gold; further escalation around the Strait of Hormuz would reignite safe-haven buying and challenge $5,343. A new 15% global tariff replacing the prior 10% rate adds another layer of dollar-supportive uncertainty that may limit the upside in the near term.
The $5,000 level remains the critical line in the sand. A weekly close below it would mark material technical deterioration and open the path toward $4,883. To the upside, a sustained daily close above $5,184 would shift near-term momentum back in favour of the bulls and set up a retest of the $5,400 channel ceiling.