
Key Takeaways
- BTC/USD is at $67,567, recovering from a $65,000 weekly low, with the 4-hour EMA 50 at $68,286 as immediate dynamic resistance.
- RSI 14 at 50.85, signal at 39.93; MACD histogram near zero with converging lines signals indecision.
- The 0.236 Fibonacci at $68,000 aligns with current resistance; the 0.382 at $61,500 and 0.618 at $52,600 are the key downside levels.
- A three-day bear flag is the dominant pattern; a close below $67,000 targets $61,500 and potentially $40,000 to $45,000; reclaiming $75,900 negates the structure.
- The FOMC hawkish hold cut 2026 rate cut projections to one, with cuts delayed toward 2027, maintaining a higher-for-longer headwind for risk assets.
- A 10% global tariff is locked in through July 24 with 15% escalation risk; BTC historically drops 12% to 18% on tariff escalation versus gold’s 4% to 6% gain.
- ETF flows ended March positive overall but reversed in the final week; the Exchange Whale Ratio at 0.79 confirms sustained institutional distribution.
- Options skew favours puts through April; the Bitcoin-to-Gold ratio at 15.07 requires a reclaim of the 180-day MA near $89,700 to turn constructive.
- Key resistance at $68,984, $71,558, and $72,749; support at $66,700 to $67,000 is the weekly pivot zone.
Market Dynamics and Recent Performance
Bitcoin enters the first week of April 2026 in fragile consolidation, with the 4-hour Bitstamp chart showing the pair at $67,567 after a session high of $67,861 and a low of $67,541. The candle structure reflects a recovery from the weekly trough near $65,000, though the broader picture remains sobering: from its October 2025 all-time high of $125,900, Bitcoin has corrected over 46%, firmly in the late-cycle drawdown phase that follows post-halving euphoria.
March closed with a barely positive 0.19% monthly gain, severely underperforming the historical March average of 10.2%, following a 10.1% January decline and a 14.8% February drop. Bitcoin spot ETFs recorded $1.13 billion in net inflows throughout March, ending a four-month outflow streak, but the final week reversed to net outflows. The Exchange Whale Ratio surged to 0.79 by March 28 from 0.34 in early January, confirming large holders have been consistently routing coins toward exchanges rather than cold storage.
Technical and Fundamental Influences
The EMA 50 sits at $68,286 on the 4-hour chart, above spot price and forming dynamic resistance that price has failed to reclaim on a closing basis. The RSI 14 reads 50.85 with the signal at 39.93, producing a modest bullish cross off the $65,000 low but lacking conviction. The daily 200-day EMA continues declining near $93,000, requiring a 38% advance to shift the long-term structure constructively.
Fibonacci retracement from the $125,900 high to the cycle low near $63,000 places the 0.236 level at approximately $68,000, aligning with the EMA 50 and explaining the current congestion. The 0.382 retracement at $61,500 and the 0.618 at $52,600 are the key downside levels on a breakdown. Immediate resistance sits at $68,984, then $71,558, with a sustained close above $72,749 needed to challenge the prevailing bear flag on the three-day chart. Daily ATR of approximately $2,561 reflects controlled consolidation rather than capitulation.
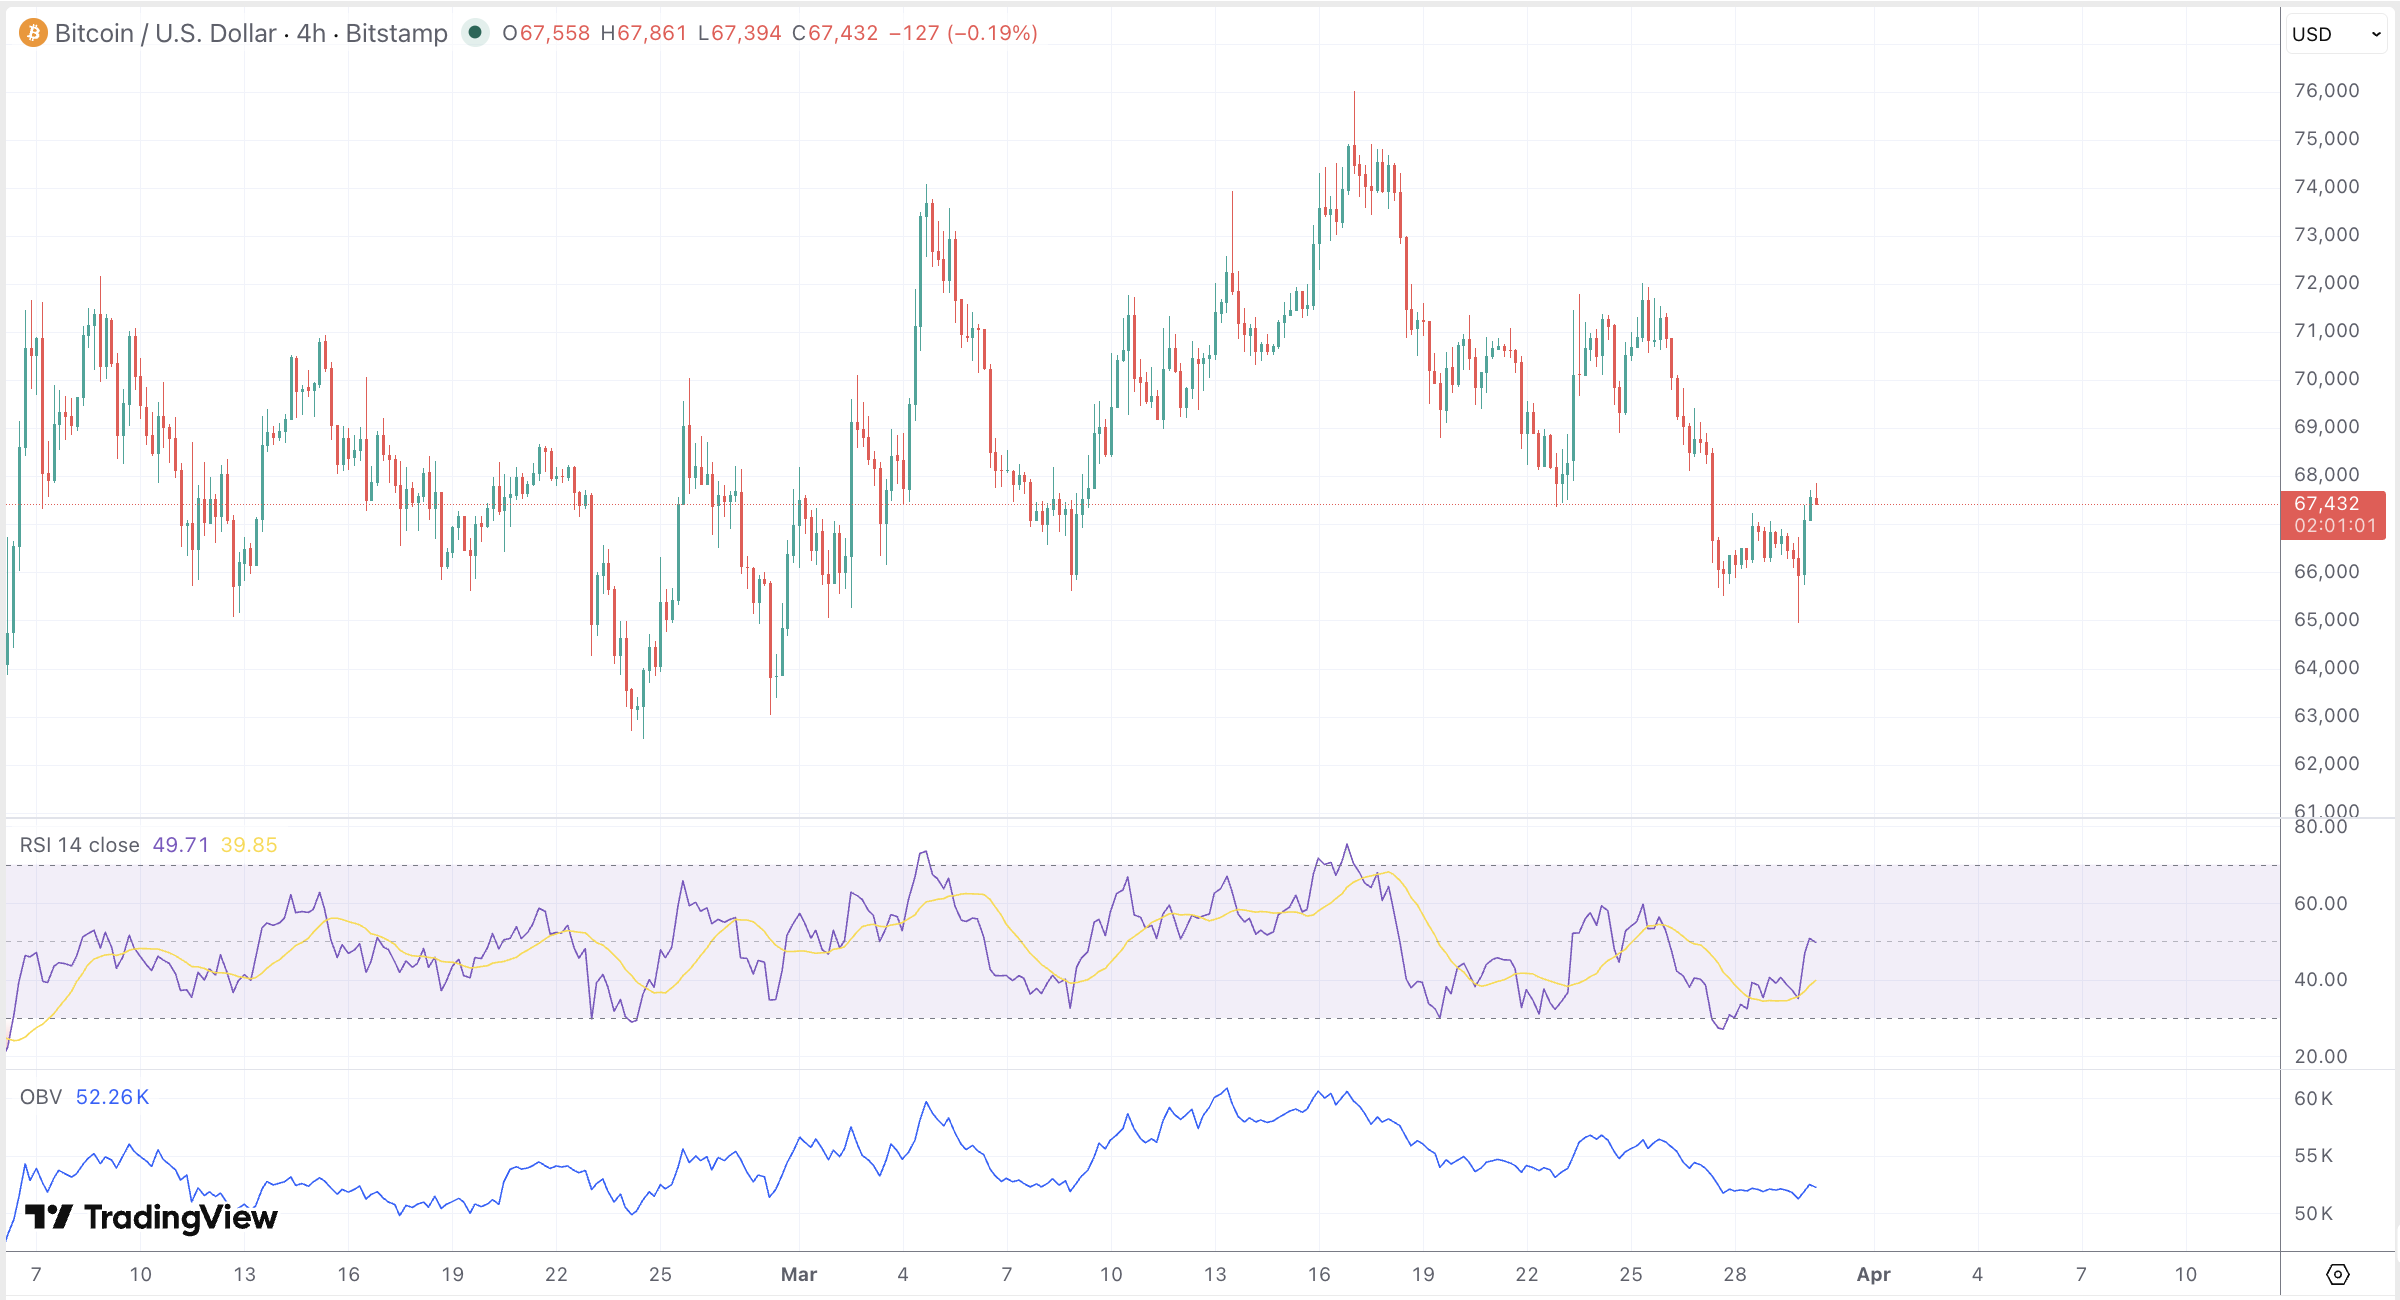
The MACD histogram sits near zero with converging lines, signalling trend indecision. Bollinger Bands are contracting around $67,000 to $70,000, a classic precursor to volatility expansion. OBV has not confirmed any recent bounce, with volume continuing to favour sellers on heavier sessions. The Parabolic SAR remains above price in a bearish configuration, and ADX in the low-to-mid twenties reflects a moderate but directionless trend. Lower highs from the $75,000 March peak persist across all timeframes above four hours.
The March 18 FOMC meeting delivered a hawkish hold, revising 2026 rate cut projections from two to one, with Powell flagging energy-driven inflation risk. The 10-year Treasury yield climbed toward 4.2%, Bitcoin fell 5% on the day, and rate cuts are now pushed toward 2027 in several market models. A fresh 10% global tariff under Section 122 is locked in through July 24, with escalation toward 15% remaining on the table. Bitcoin has historically declined 12% to 18% on tariff escalation events versus gold’s 4% to 6% gain, reinforcing its high-beta risk-asset identity. The Bitcoin-to-Gold ratio sits at 15.07, down 4% on the week, and only turns constructive if BTC reclaims the 180-day moving average near $89,700. Strategy has accumulated approximately 45,000 BTC in the past 30 days, representing 76% of all corporate treasury purchases, but this has been insufficient to offset whale distribution of over $37.5 billion in BTC since October 2025. Options market skew favours puts through April, and Powell’s May 2026 term expiry with his succession stalled in the Senate adds a layer of policy uncertainty at a critical moment.
Looking Forward
The dominant pattern entering April is the three-day bear flag. The 50% decline from $125,900 to approximately $63,000 forms the pole, and the current tight consolidation is the flag. A confirmed three-day close below $67,000, with declining ETF inflows and an elevated Whale Ratio, would project a measured move to $40,000 to $45,000. Conversely, a recovery above $75,900 would weaken the pattern and shift the bias to constructive.
For this week, the $66,700 to $67,600 support band is the critical pivot. Holding it with volume on bullish sessions opens a test of the EMA 50 at $68,286 and then $69,000. A break below $66,400, and especially $65,000, exposes the $61,500 Fibonacci level. The Fear and Greed Index at 12 in Extreme Fear territory is historically associated with exhausted selling, but the index has remained suppressed unusually long in this cycle without triggering a mean-reverting recovery.
