Key Takeaways
- XAU/USD settled around $5,079, down 0.86%, with the 50-period EMA at $5,156 acting as immediate overhead resistance
- The correction from the $5,595 all-time high is approximately 14%, with consolidation currently between $4,350 and $4,550
- RSI 14 reads 38.57 fast / 51.54 signal; Parabolic SAR bearish; MACD below zero on the daily; ADX weakening, indicating fading downtrend momentum
- Key support: $4,426, $4,352, $4,263, $4,100; key resistance: $4,529, $4,544, $4,601, $4,700
- CME FedWatch prices zero rate cuts for 2026, keeping real yields elevated and the dollar supported as structural gold headwinds
- NFP on April 3 is the decisive weekly catalyst; a weak print targets $4,600 to $4,700, a strong print risks a return to $4,263 to $4,350
- Geopolitical risk from the Middle East remains a latent bullish driver, offset by the inflationary impact of higher oil prices
- The long-term bullish structure remains intact above the 200-day EMA, but a weekly close above $5,000 is needed to confirm bulls have regained control
Market Dynamics and Recent Performance
Gold has endured one of the most punishing corrections of the current cycle, shedding more than 14% from its all-time high of $5,595 reached on January 29 to lows that briefly touched $4,099 in mid-March before staging a partial recovery. The 4-hour chart captures this with stark clarity: XAU/USD opened the latest session at $5,123, printed a high of $5,130, traded to a low of $5,055, and settled around $5,079 for a loss of $44 or 0.86%. The 50-period EMA, currently reading $5,156, sits above price and continues to slope downward, reinforcing the near-term bearish structure in place since the March 2 peak near $5,420.
The broader narrative is one of a market caught between two contradictory forces. Escalating Middle East tensions involving US and Israeli military activity have stoked safe-haven demand, yet the same conflict is driving oil sharply higher, reigniting inflation concerns and forcing the Federal Reserve to maintain its hawkish posture. The result is a gold market that has paradoxically sold off through an active geopolitical crisis, as rising real yields raise the opportunity cost of holding a non-interest-bearing asset. The CME FedWatch tool now prices zero rate cuts for 2026, a dramatic reversal from the three cuts priced at the start of the year, and that repricing has been a persistent headwind for bullion throughout the quarter.
After bottoming near $4,099, gold has recovered into the $4,400 to $4,550 range, with trading on March 30 expected within a $4,376 to $4,510 band. The week ahead carries high event risk: JOLTS job openings on Tuesday, ADP Employment Change and Manufacturing PMI on Wednesday, initial jobless claims on Thursday, and the decisive March Nonfarm Payrolls report on Friday. Each release carries the potential to materially shift rate cut expectations and gold’s near-term trajectory.
Technical and Fundamental Influences
The RSI on the 4-hour chart reads 38.57 for the fast line and 51.54 for the signal line, a configuration that reflects tension between near-term bearish momentum and a signal line that has not yet confirmed a full breakdown below neutral. At the mid-March lows, RSI printed near 20, marking an oversold extreme before the bounce. With the fast line below its signal, the setup leans bearish but is not generating a fresh sell signal, implying further consolidation before the next directional commitment.
The 50-day EMA near $4,960 acted as the catalyst for the March breakdown when price breached it on March 18 with a 3.7% single-day loss and now functions as medium-term resistance. The 200-day EMA around $4,200 to $4,400 is the critical bull/bear dividing line; price holding above it is the one technical fact keeping the long-term bullish case intact. Fibonacci retracement of the February-to-March rally from $4,402 to $5,420 places the 38.2% level near $4,790, the 50% at $4,911, and the 61.8% at $5,031. Current price action has pushed through all three and is testing the 78.6% retracement near $4,420. Key support sits at $4,426, $4,352, $4,263, and $4,100. Resistance is clustered at $4,529, $4,544, $4,601, and $4,700.
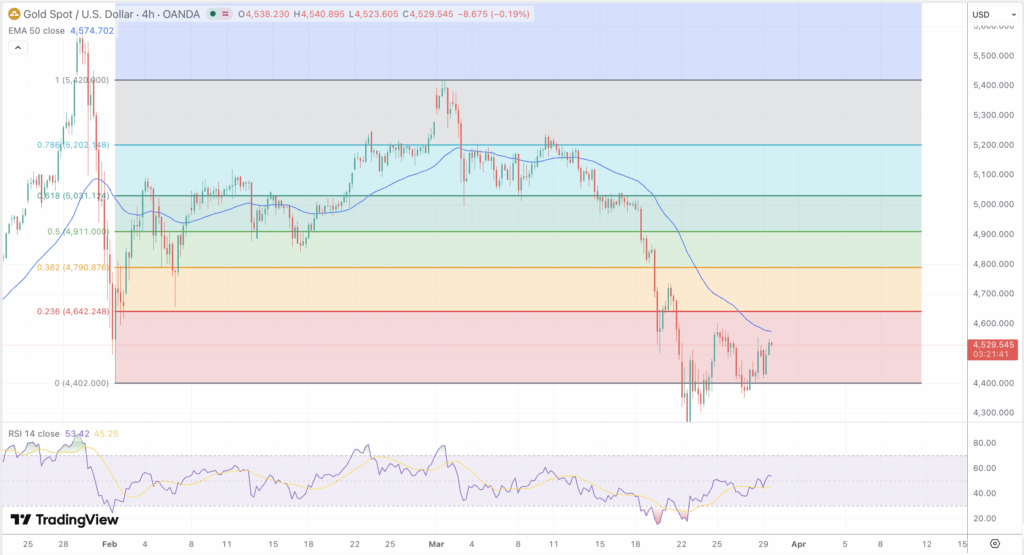
The daily MACD has crossed the zero line from above and continues declining in negative territory, foreshadowed by a Bearish Engulfing pattern in the $5,262 to $4,954 range and a weekly Dark Cloud Cover in the $5,598 to $4,954 area. Bollinger Bands are compressing after the sell-off, a configuration that typically precedes the next directional expansion. Parabolic SAR remains bearish on the 4-hour chart with dots capping rallies above price. ADX is weakening, suggesting the downtrend is losing momentum, consistent with OBV stabilising after declining sharply through the corrective phase. ATR remains elevated relative to historical norms, keeping short-term risk high in both directions.
On the fundamental side, the Fed funds rate at 3.50% to 3.75% with no credible easing pathway keeps real yields elevated and the US Dollar Index supported above 100. Gulf equity markets have seen sharp outflows as investors cut Middle East exposure, and marine insurance premiums are rising. Whether gold can attract safe-haven flows in this environment remains uncertain given that higher oil prices are themselves a driver of the inflation that keeps the Fed on hold. The Supreme Court’s anticipated ruling on presidential tariff authority under IEEPA adds another potential macro shock, with direct implications for dollar positioning and gold’s valuation.
Looking Forward
The NFP report on Friday April 3 is the week’s primary catalyst. A strong print with firm average hourly earnings would further cement zero-cut pricing for 2026 and likely push XAU/USD back toward the $4,263 to $4,350 support cluster. A weak outcome, particularly if unemployment rises and wage growth softens, could revive rate cut expectations and give gold the fundamental basis for a sustained move above $4,529 toward the $4,600 to $4,700 resistance zone.
The medium-term recovery thesis requires price to establish a clean floor in the $4,350 to $4,426 area before the data-heavy week concludes. Geopolitical escalation remains a latent bullish catalyst, particularly as the 10-day extension of the pause on potential US action against Iranian energy infrastructure expires around April 6. Consensus forecasts still envision gold recovering toward the $5,155 to $5,515 range over the medium term, but the path there requires either a clear dovish Fed shift or a material risk-off escalation that overcomes the inflation headwind. A weekly close above $5,000 remains the minimum threshold to confirm the corrective phase has ended and that bulls have regained structural control.