
Key Takeaways
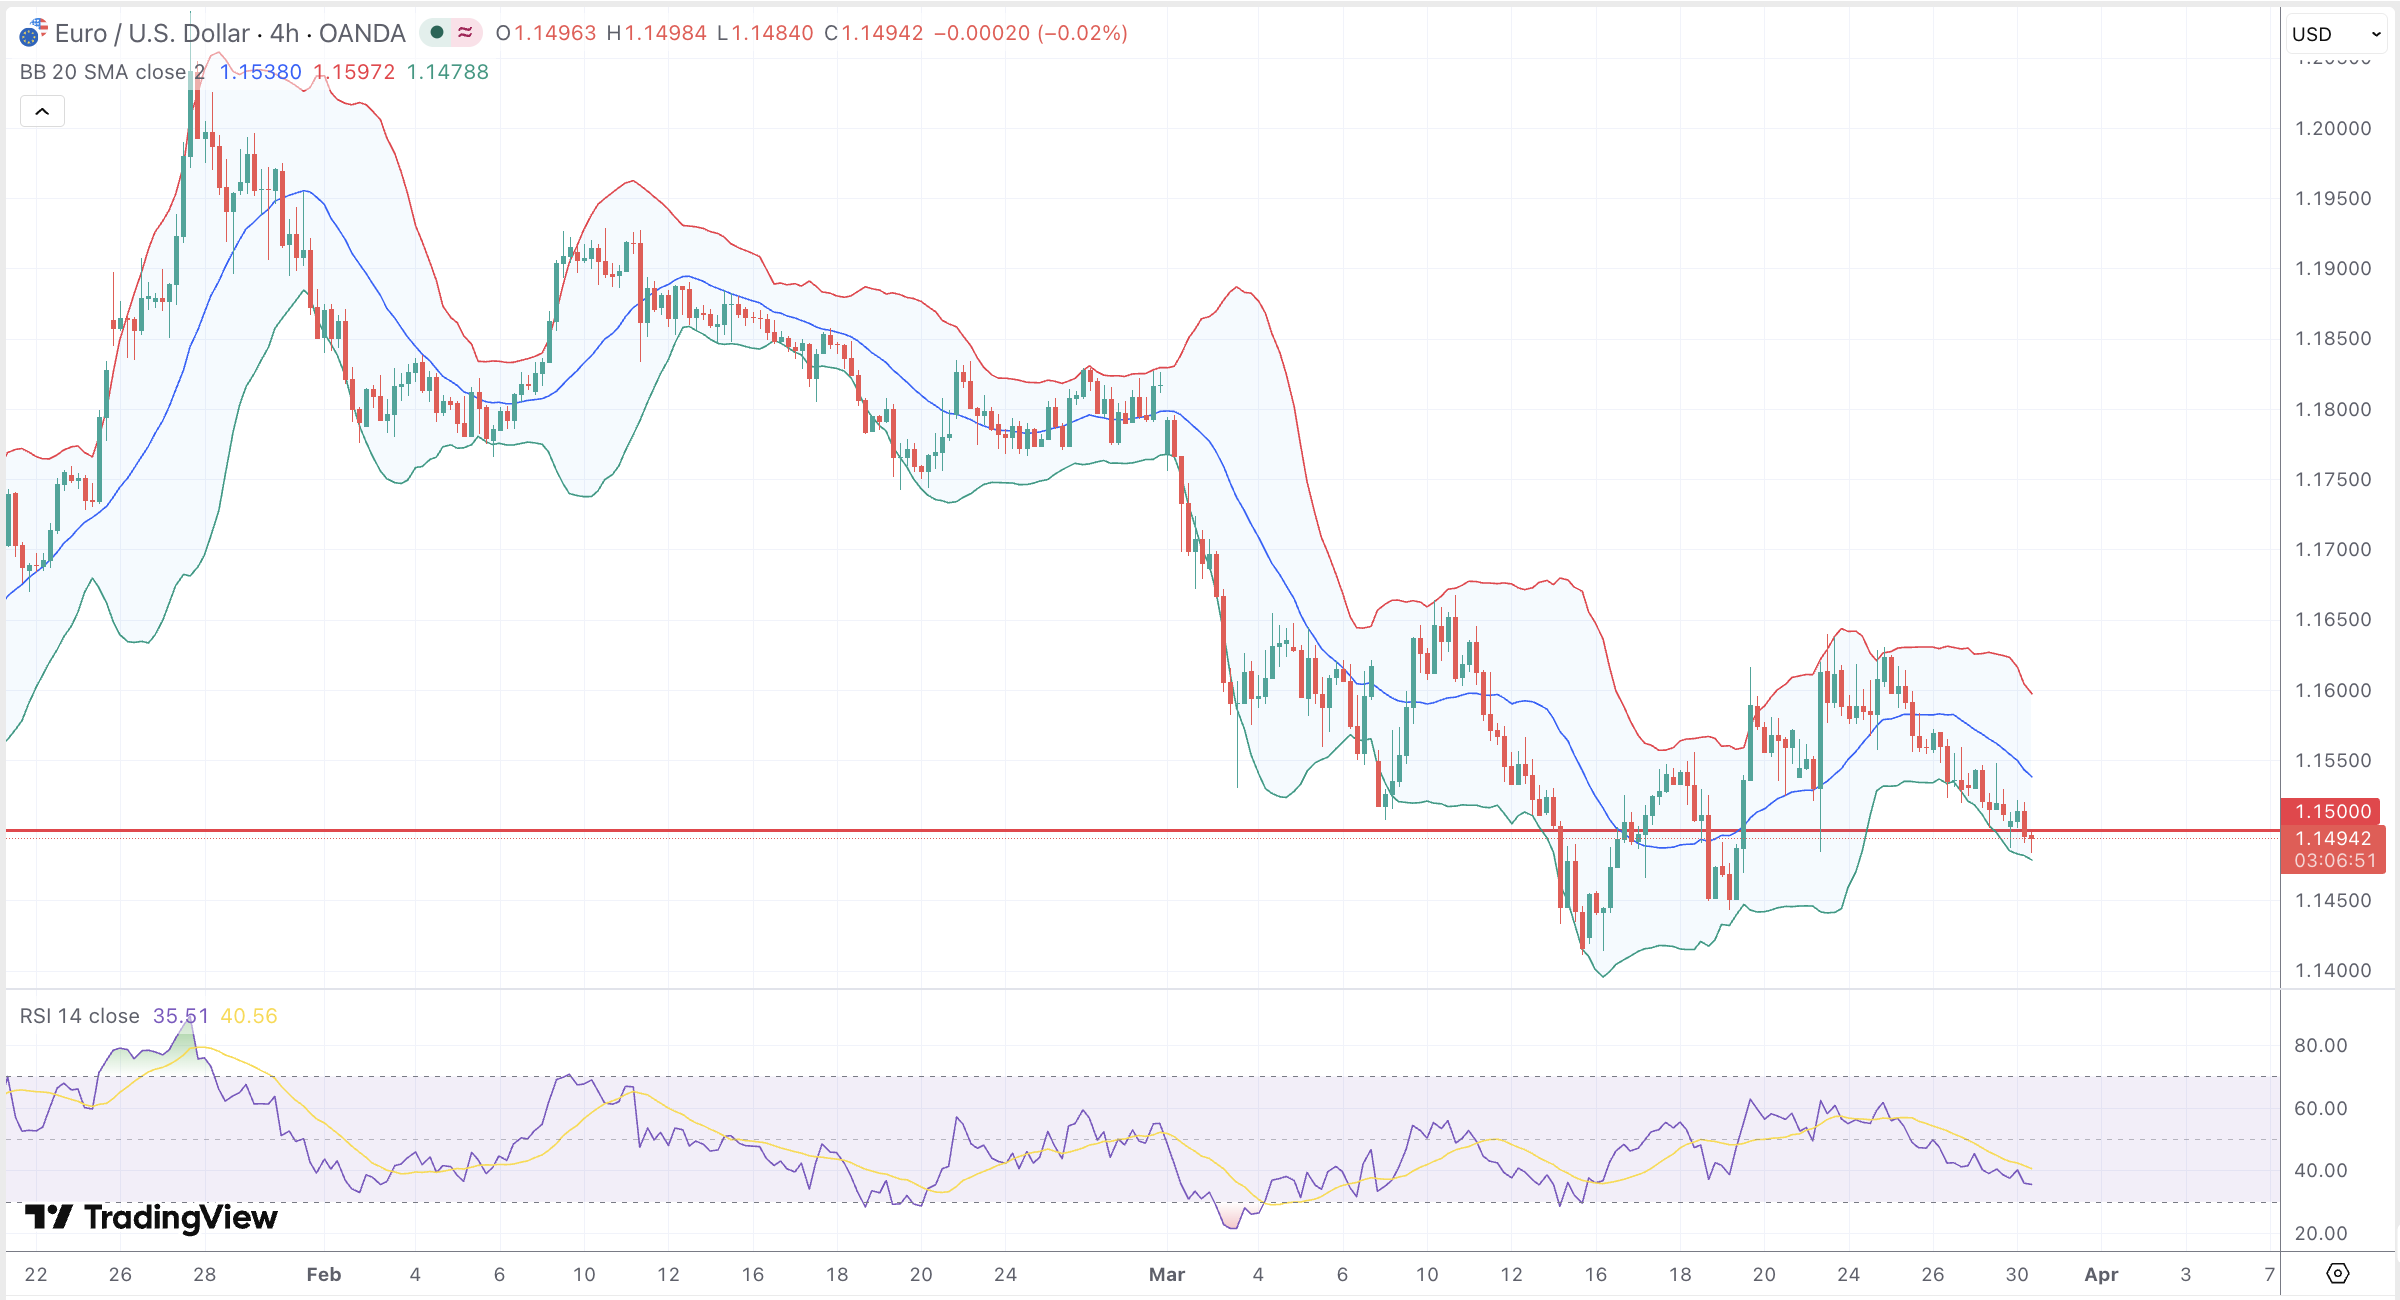
- EUR/USD trades at $1.1492, below the 4-hour EMA 50 at $1.1545 and the daily 200-day SMA near $1.17, with all major moving averages on sell signals confirming the medium-term downtrend.
- RSI at 34.97 with signal at 40.52 shows deteriorating momentum without reaching extreme oversold levels; MACD is negative on both the daily and 4-hour charts, and ADX at 30.14 confirms trend integrity.
- Parabolic SAR at $1.1556 provides bearish dynamic resistance; Bollinger Bands place price in the lower half of the range with upper band resistance near $1.1630.
- Critical support is $1.1500; a confirmed daily close below it exposes $1.1410 and $1.1400, while the Fibonacci pivot at $1.1515 and the 5-day moving average form the key intraday bull-bear line.
- The US-Iran April 6 deadline is the dominant risk event; Strait of Hormuz escalation is the primary tail scenario pointing toward $1.1400 or lower, while a diplomatic breakthrough could lift the pair to $1.1620 to $1.1650.
- ECB at 2.0% versus Fed at 3.75%, with Goldman Sachs delaying cut expectations to December 2026, keeps the rate-differential floor under the dollar and caps the pace of any euro recovery.
Market Dynamics and Recent Performance
EUR/USD enters the week of March 30 under sustained selling pressure, trading at $1.1492 on the 4-hour chart as of Monday morning, with the current candle printing an open of $1.1496, a high of $1.1498, and a low of $1.1491. The pair has retreated sharply from its January peak above $1.2000, with March extending that correction materially across a weekly range of $1.1352 to $1.1575. EUR/USD is now testing levels not seen since the autumn of 2025, and the technical picture increasingly favours further downside before any meaningful recovery can take root.
The dominant narrative is a combination of elevated geopolitical risk and a reassessment of Federal Reserve policy timing. The Middle East conflict between the US and Iran has injected a significant safe-haven premium into the dollar, with Brent crude trading at or above $100 a barrel reviving inflation concerns and prompting traders to reduce euro exposure. The eurozone is structurally vulnerable to energy shocks given its dependence on imports, and that vulnerability is now being priced aggressively. President Trump extended his Iran nuclear deal deadline by 10 days to April 6, maintaining a military posture that markets are reading as credibly aggressive, with the UN warning that the current US buildup in the region is the largest since 2003.
German consumer confidence slumped to a two-year low heading into April, Spain’s inflation surged to 3.3% in March, its highest since June 2024, and eurozone PMI surveys pointed to slower growth momentum, reinforcing a picture of stagflationary pressure that weighs on risk appetite and the euro specifically.
Technical and Fundamental Influences
The technical structure across multiple timeframes is uniformly bearish. On the 4-hour chart, the EMA 50 sits at $1.1545, well above the current price of $1.1492, and each attempted rally has been sold into. The RSI reads 34.97 on the primary line with the signal line at 40.52, placing momentum in near-oversold territory but not yet at levels that have historically prompted sharp reversals. The signal line is decaying faster than the RSI itself, suggesting deteriorating momentum rather than an imminent recovery setup. All major moving average periods from the 5-day through the 200-day SMA near $1.17 are generating sell signals on the daily timeframe, a rare alignment pointing to trend continuation.
The 76.4% Fibonacci retracement from the 2021-2022 major move at $1.1686 has acted as resistance on the most recent corrective rally. Below current price, $1.1500 is a psychologically and technically well-defined floor that attracted repeated buying in Q4 2025. A confirmed daily close below it would expose the $1.1410 Fibonacci extension and the $1.1400 round number. The Fibonacci pivot for the daily session sits at $1.1515, coinciding with the 5-day moving average and forming a dense confluence zone. The MACD reads -0.001 on the daily chart, below its signal line, with the 4-hour histogram also in negative territory confirming momentum is not yet exhausted to the downside. The ADX registers at 30.14, confirming an established directional trend rather than a low-conviction drift, while the Parabolic SAR is positioned above price at $1.1556, providing bearish dynamic resistance. ATR sits at 0.00195 but any Middle East escalation could rapidly expand that range. Bollinger Bands place price in the lower half of the channel, with the upper band near $1.1630 aligning with resistance identified by Scotiabank at $1.1620. On-balance volume continues to trend lower, indicating distribution rather than accumulation.
On the fundamental side, the ECB deposit rate sits at 2.0% after four consecutive holds, with markets now pricing at least two rate increases by year-end as energy-driven inflation reverses earlier cut expectations. Lagarde has signalled readiness to adjust policy “at any meeting,” leaving all options open. The Fed funds rate holds at 3.75%, with Goldman Sachs pushing cut expectations to December 2026 at the earliest following a fresh uptick in US inflation. The DXY has recovered more than 5% from its February low to trade near 99.65, reflecting genuine near-term dollar support. Germany’s EUR 1 trillion fiscal spending program on infrastructure and defence remains a medium-term euro positive, though it offers little traction for this week’s price action.
Looking Forward
The week ahead is dominated by two intersecting risk streams: Iran geopolitics and a series of macro data releases. Trump’s April 6 deadline is the single most important event for EUR/USD. A credible diplomatic breakthrough would unwind safe-haven dollar demand and allow the pair to recover toward the $1.1550 to $1.1620 resistance band, while any military escalation involving the Strait of Hormuz, through which roughly 20 million barrels of oil per day transit, would likely drive the pair toward $1.1400 and potentially beyond. Eurozone composite PMIs, ECB commentary, and US core PCE data will act as secondary drivers, though ING’s view is that macro inputs will have limited impact relative to the geopolitical overhang as long as oil remains elevated.
Key resistance zones for any corrective rally sit at $1.1626 to $1.1648, with a broader confluence zone extending to $1.1690 to $1.1720 combining historical supply, the Fibonacci golden zone, anchored VWAP, and a Fair Value Gap from the prior impulse lower. A daily close above the Parabolic SAR at $1.1556 would begin to neutralise the bearish setup, but that scenario requires either meaningful de-escalation on Iran or a dovish Fed signal that current data does not support.