Key Takeaways
- XAU/USD is trading at $4,390 after an intraday crash to $4,099, down over 21% from the January all-time high of $5,595, with the seven-session losing streak the longest since 2023.
- RSI(14) at 26.40 is deeply oversold and historically associated with multi-session bounces, but MACD bearish expansion and ADX above 30 confirm the downtrend retains genuine momentum.
- Fibonacci retracement places the 50% level near $4,276 and the 61.8% level at $4,000; the 200-day EMA near $4,200 is the critical bull/bear dividing line on the chart.
- Parabolic SAR is in full bearish configuration across timeframes; OBV reflects institutional-scale selling; ATR spike confirms extreme volatility conditions remain in place.
- The hawkish March FOMC hold trimmed 2026 rate cut projections to one, raised core PCE to 2.7%, and pushed the 10-year yield to 4.2% and DXY toward 99.9, all direct headwinds for gold.
- The Middle East oil shock has produced a macro paradox: surging energy prices reinforce Fed hawkishness, causing gold to sell off despite the geopolitical backdrop that would normally support safe-haven demand.
- Key resistance on any bounce sits at $4,550, $4,800, and the $5,000 psychological ceiling. US PMI Monday and jobless claims Thursday are the primary scheduled catalysts for the week.
- P. Morgan and Deutsche Bank maintain year-end 2026 targets of $6,300 and $6,000, viewing the correction as tactical within a structural bull market underpinned by persistent central bank demand.
Market Dynamics and Recent Performance
Gold is entering the week of March 24 in deeply damaged technical territory, with spot XAU/USD trading at $4,390 after tagging an intraday low of $4,099 earlier in the session. That print marked the most acute moment of a sell-off that has erased more than 21% from the January 29 all-time high of $5,595. The seven-session consecutive losing streak preceding the weekend was the longest uninterrupted decline on the daily chart since 2023, and the weekly candle’s range from $4,536 to $4,099 underscores the sheer volatility now gripping the market.
The correction intensified dramatically around March 19, when a flash crash during the New York open saw prices plunge 6.9% intraday to $4,558 before a partial recovery. Gold had spent the better part of early 2026 consolidating above $5,000 before the $5,000 psychological level was surrendered, triggering a cascade of stop-loss orders across algorithmic systems and forcing margin-call liquidations in the futures complex. Open interest in April 2026 gold futures contracted sharply as speculative long positions were unwound at an accelerated pace, removing a key pillar of the prior uptrend. The 52-week range now spans $2,957 to $5,595, with current prices sitting well below the 50-day moving average at $5,076.
Technical and Fundamental Influences
The daily RSI(14) has collapsed to 26.40, a deeply oversold reading not visited since the 2023 trough, while the signal line holds at 46.30, confirming that momentum remains overwhelmingly bearish. Historically, RSI at this level on the daily gold chart has preceded multi-session bounces of 3% to 6%, though it does not constitute a trend reversal signal in isolation. The MACD has widened its bearish divergence substantially, with the histogram posting successive negative bars of increasing magnitude. The 5-day EMA has rolled sharply lower and trades well below both the 50-day EMA at $5,076 and the 200-day EMA near $4,200, the single most critical structural reference on the chart.
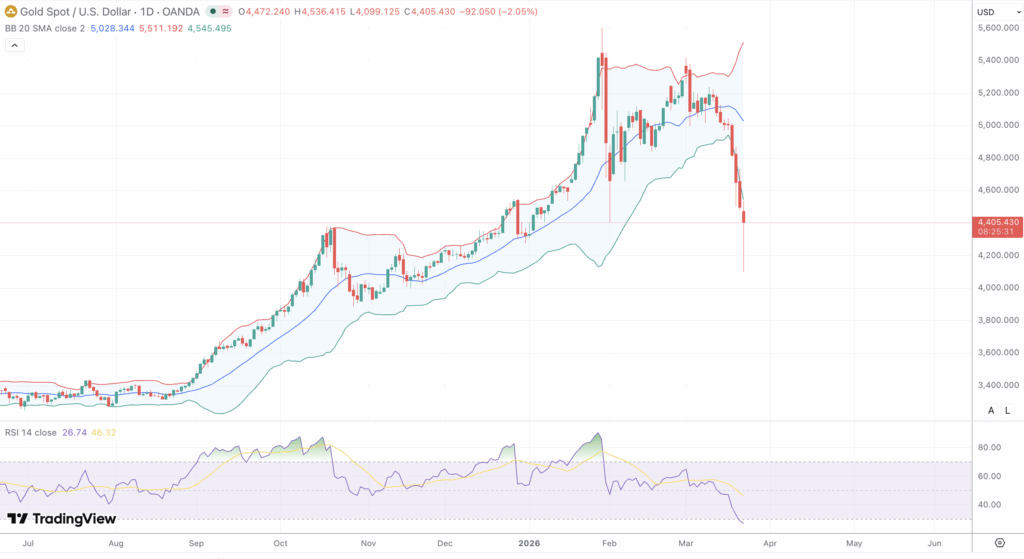
Fibonacci retracement of the primary bull leg from the 2023 base to the $5,595 high places the 38.2% level at approximately $4,550, a level decisively broken last week. The 50% retracement falls near $4,276, and the 61.8% retracement sits at approximately $4,000, the psychological floor and origin of the broader bull market structure. The Parabolic SAR is firmly in bearish mode across all timeframes, with dots printed well above price. ATR has spiked significantly, indicating extreme volatility conditions, while ADX has risen above 30, confirming that the downtrend carries genuine directional force. Bollinger Bands have expanded dramatically with price pressing the lower band for multiple consecutive sessions, a volatility exhaustion pattern when accompanied by oversold oscillators. OBV has turned steeply lower, reflecting institutional character in the selling. Friday’s session printed a long lower wick after tagging $4,099, suggesting demand emerged at that level, though the candle failed to recapture $4,400 with conviction. The 200-day EMA near $4,200 is the pivotal support line; below it, the next structural reference falls at $4,000.
The fundamental catalyst for this correction was the March 18 FOMC decision. The Fed held rates at 3.50% to 3.75% in an 11-to-1 vote but revised its dot plot to show only one rate cut in all of 2026, down from two in December. The February PPI came in at +0.7%, well above consensus, and the Fed raised its core PCE inflation forecast to 2.7%. The 10-year Treasury yield responded by jumping to 4.2% and the US Dollar Index climbed toward 99.9, delivering a dual headwind to non-yielding gold. The defining paradox of this correction is that the active US-Israeli strikes on Iranian territory, which have disrupted the Strait of Hormuz and sent Brent crude above $108 per barrel, would under normal conditions boost safe-haven demand. Instead, the oil shock feeds directly into inflation expectations, reinforcing the Fed’s hawkish posture. Higher oil means higher inflation, higher inflation keeps rates elevated, and elevated real yields make gold structurally less attractive relative to Treasury instruments. Central bank demand, a structural support across three consecutive years of buying, has not reversed. J.P. Morgan and Deutsche Bank have maintained their year-end 2026 targets of $6,300 and $6,000 respectively, characterizing the pullback as a tactical event inside a structural bull market.
Looking Forward
The week ahead presents several high-impact catalysts. US March manufacturing and services PMI data on Monday will provide the first read on economic momentum in the post-FOMC environment, while initial jobless claims on Thursday will be watched for any labor market softening that could moderate the Fed’s stance. Any upside surprise in either print would likely reinforce the hawkish narrative and bring the 200-day EMA near $4,200 back into immediate focus as the next downside target.
With RSI at 26.40, the probability of a countertrend bounce is elevated. A recovery toward $4,550 and potentially $4,800 is plausible if buyers continue to defend the $4,099 to $4,200 demand zone. A daily close below the 200-day EMA would open measured-move targets toward $3,800 and ultimately $3,500, the base of the 2025 to 2026 bull run. Geopolitical developments retain the capacity to produce sharp reversals in either direction. Any ceasefire signal or Strategic Petroleum Reserve release that pulls crude lower could paradoxically become bullish for gold by reducing inflation fears and reopening the rate-cut narrative. The DXY and the 10-year Treasury yield remain the primary real-time proxies for gold’s direction, with a DXY break below 98 and yields retreating under 4.0% representing the key threshold for a sustained recovery setup.