
Key Takeaways
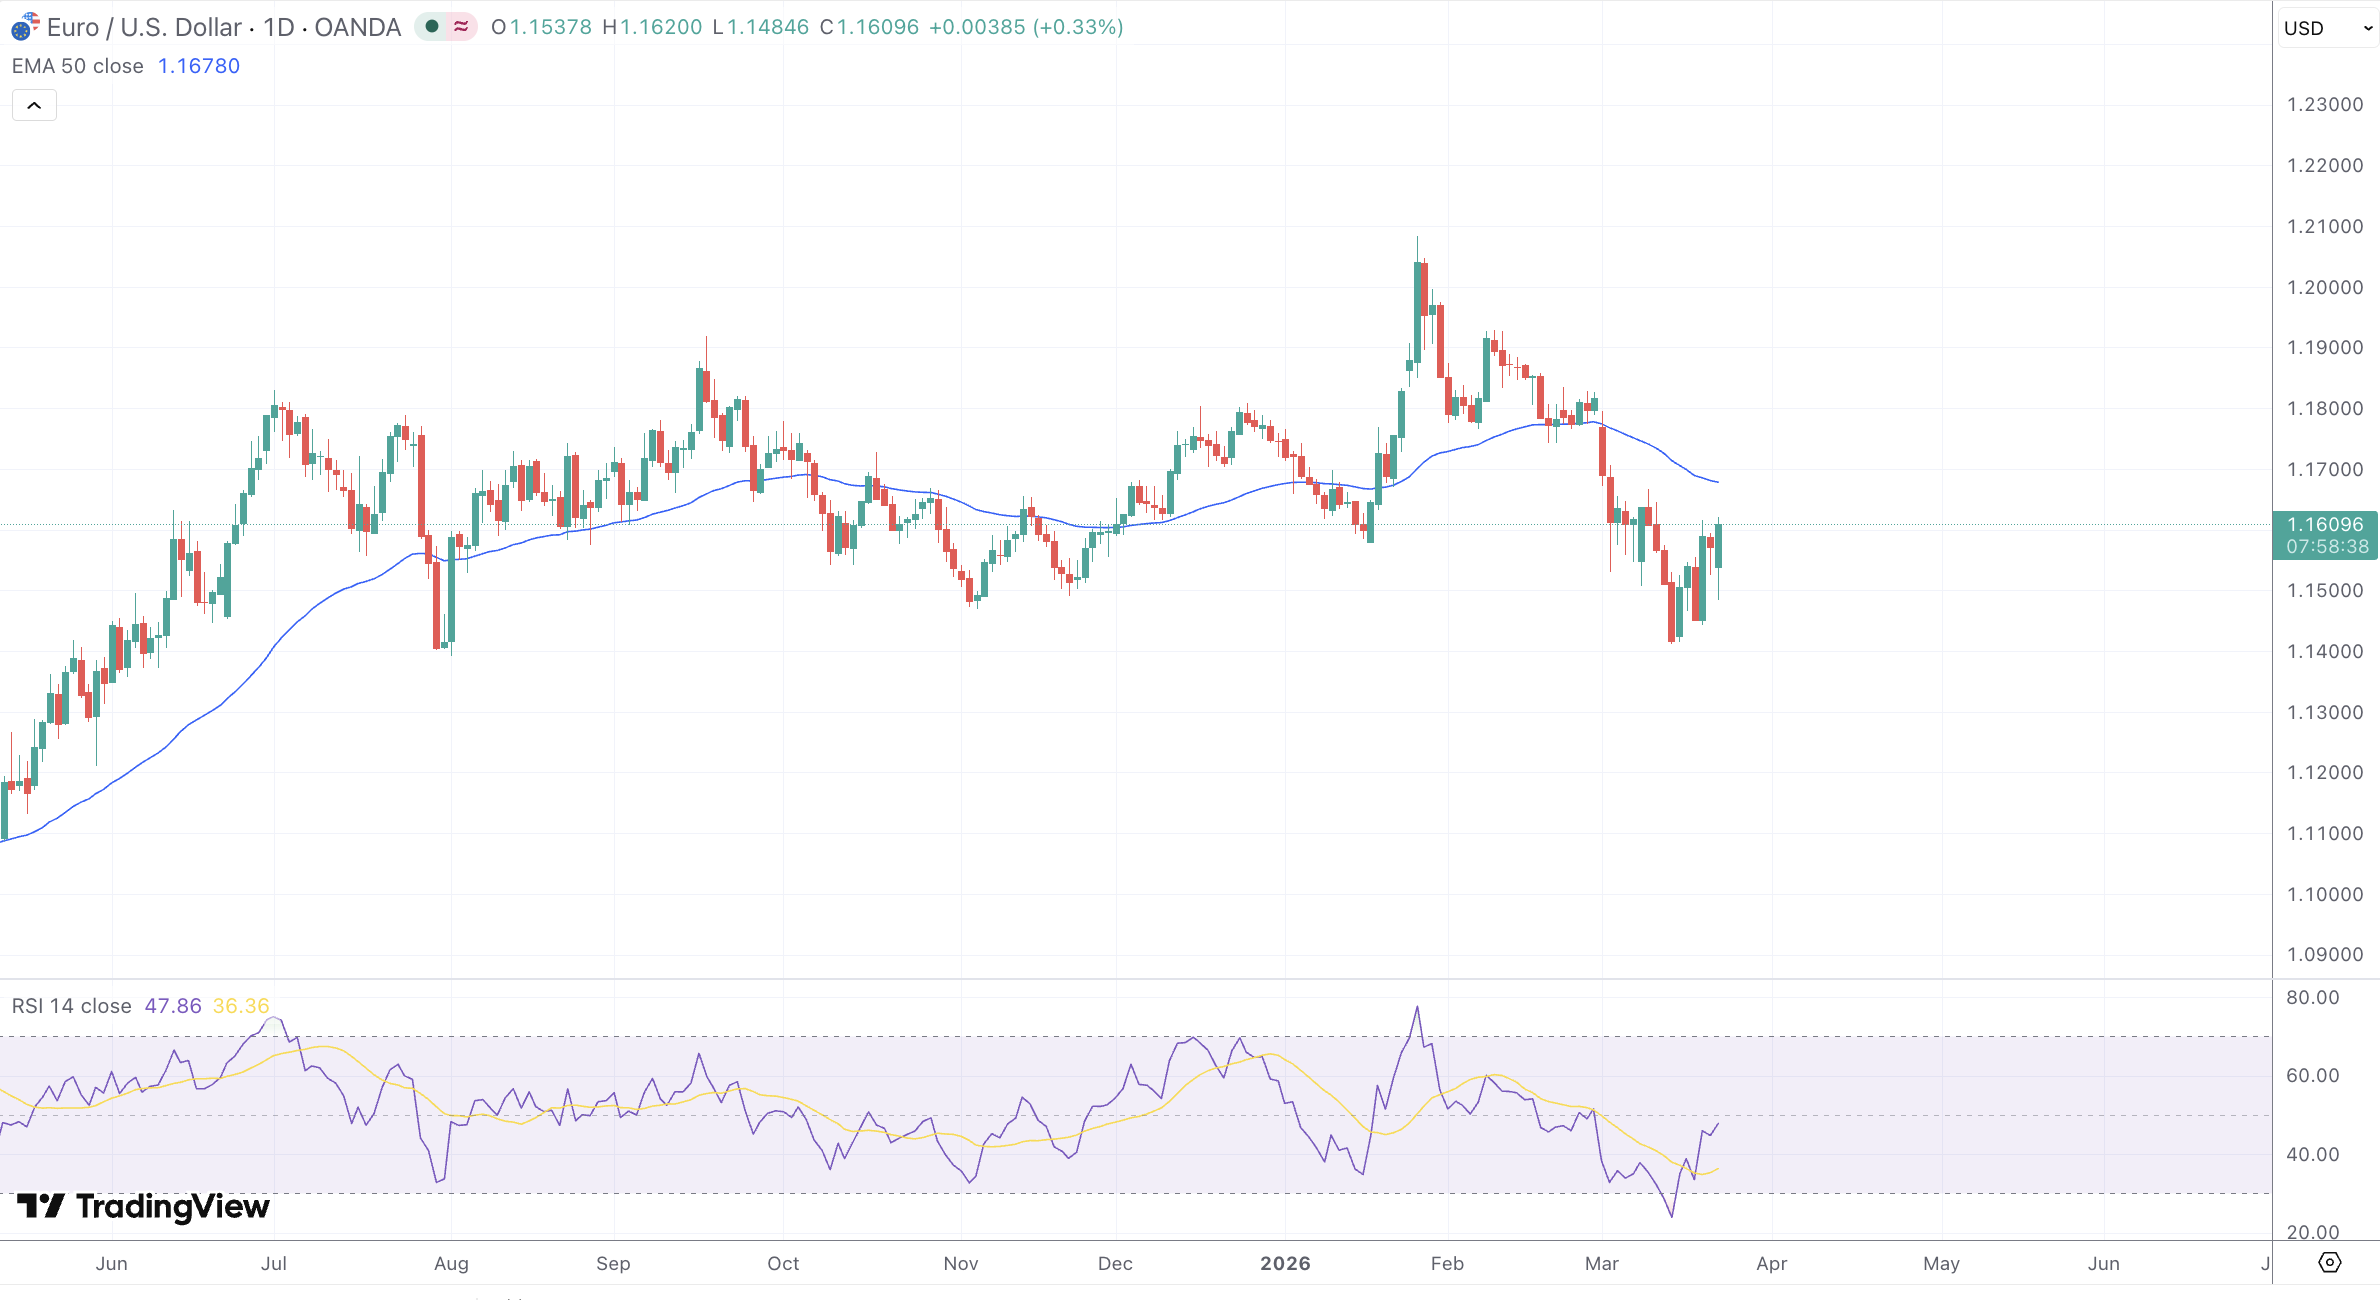
- EUR/USD is at 1.1568, consolidating above the 2026 low of 1.1430 with RSI at 44.54/36.12 (fast/signal), suggesting stabilization but no confirmed reversal.
- Full bearish EMA stack (5-day, 50-day, 200-day), Parabolic SAR above price, and ADX above 28 confirm dominant downtrend with intact trend strength.
- The 61.8% Fibonacci retracement at 1.1551 is the critical near-term support; a break below targets 1.1374 and then the 1.1310 extension level.
- Resistance clusters between 1.1620 and 1.1680, where flipped EMAs and Fibonacci levels converge.
- The ECB held at 2.0% but raised 2026 inflation to 2.6% and cut growth to 0.9%, a stagflationary mix offering limited support for the euro.
- The Fed held at 3.50% to 3.75% and projects only one cut in 2026, removing the rate-differential tailwind that buoyed EUR/USD through 2025.
- Brent above $100 and a closed Strait of Hormuz sustain safe-haven dollar demand; de-escalation is the primary upside catalyst.
- Bearish scenario targets 1.1280 to 1.1165 on further escalation; bullish scenario reopens 1.1700 to 1.1800 on ceasefire progress.
Market Dynamics and Recent Performance
EUR/USD is trading at 1.1568 as the week of March 23 opens, having printed a high of 1.1620 and a low of 1.1485 on the prior daily candle. The pair remains in retreat from the early-February multi-month peak near 1.2200, shedding more than 500 pips in a decline that accelerated when US-Israeli forces struck Iranian nuclear infrastructure in late February. That geopolitical rupture triggered a broad flight to dollar safety, pushing the pair to a 2026 low near 1.1430 before a modest recovery carried it back toward 1.1580 in the final sessions of last week.
The daily RSI reads 44.54 on the fast line and 36.12 on the signal, reflecting a pair still in corrective territory but beginning to stabilize from an oversold extreme. The final two sessions produced small-bodied candles with lengthening lower wicks, a tentative sign of dip-buying interest. The 1.1580 area, which served as meaningful support through late 2025, has flipped into a near-term ceiling. A sustained daily close above it is required before any technical recovery narrative carries weight.
Technical and Fundamental Influences
The technical structure is firmly bearish. The 5-day EMA sits below the 50-day, which is below the 200-day, confirming a full bearish EMA stack. Both the 50-day and 200-day EMAs are positioned near 1.1700, acting as layered overhead resistance after price broke below the 200-day in early March. The Parabolic SAR dots remain above price on the daily frame, and the MACD histogram is negative, though its expansion rate has slowed in line with the recent consolidation. ADX is tracking above 28, confirming trend strength within the bearish impulse. Bollinger Bands are expanding with price hugging the lower band near 1.1430, while OBV has declined steadily over three weeks, confirming that volume has accompanied rather than contradicted the selling pressure. ATR remains elevated, reflecting the heightened volatility driven by the geopolitical backdrop.
From a Fibonacci standpoint, the primary retracement from the January swing low at 1.1150 to the February high at 1.2200 places the 61.8% level at 1.1551 and the 78.6% at 1.1374. Current price at 1.1568 represents a direct test of the 61.8% retracement. A daily close below 1.1551 targets 1.1374, with the 127.2% Fibonacci extension projecting further downside toward 1.1310. On the upside, the 50% retracement sits at 1.1675 and the 38.2% level near 1.1800, both aligning with the resistance cluster that short-side traders are likely to defend.
On the fundamental side, the Iran conflict is the dominant driver. Following the killing of Supreme Leader Khamenei, new Iranian leadership pledged to keep the Strait of Hormuz closed, creating a persistent energy supply shock. Brent has surpassed $100 per barrel and WTI trades above $90. The ECB’s staff projections now incorporate an adverse scenario peaking at $119 per barrel in Q2 2026. That shock is flowing directly into eurozone inflation, with the ECB revising its 2026 HICP forecast to 2.6% from a prior 1.9%, while slashing the eurozone growth outlook to just 0.9%, a stagflationary combination that constrains policy options. The ECB held rates for a sixth consecutive meeting at a deposit rate of 2.0%, though Nagel and Villeroy de Galhau flagged a possible April hike if inflation broadens. Markets are fully pricing a rate rise by June with roughly 60% probability on May. Meanwhile the Fed held at 3.50% to 3.75%, revised PCE inflation higher to 2.7% for end-2026, and cut its rate cut projections to a single move this year. CFTC non-commercial data showed a reduction of approximately 28,900 long EUR/USD contracts in the latest reporting week, confirming speculative players are unwinding euro exposure.
Looking Forward
Geopolitical headlines will continue to outweigh scheduled data, though Eurozone PMIs and German IFO sentiment will be monitored for signs that the energy shock is spreading into broader economic deterioration. Technically, a corrective bounce toward 1.1620 to 1.1650 is possible but likely to attract renewed selling, with 1.1680 representing the upper boundary where Fibonacci resistance and flipped moving average levels converge. Failure to close above 1.1650 keeps the structure pointed toward a retest of 1.1480 to 1.1430, and a break below 1.1374 would open downside toward 1.1310 to 1.1280. De-escalation or credible ceasefire signals around the Strait of Hormuz represent the key upside risk, with scope for a short-covering rally toward 1.1700 to 1.1800 in that scenario. The pair’s behavior around 1.1580 to 1.1600 in early trading will serve as the week’s primary directional tell.