
Key Takeaways
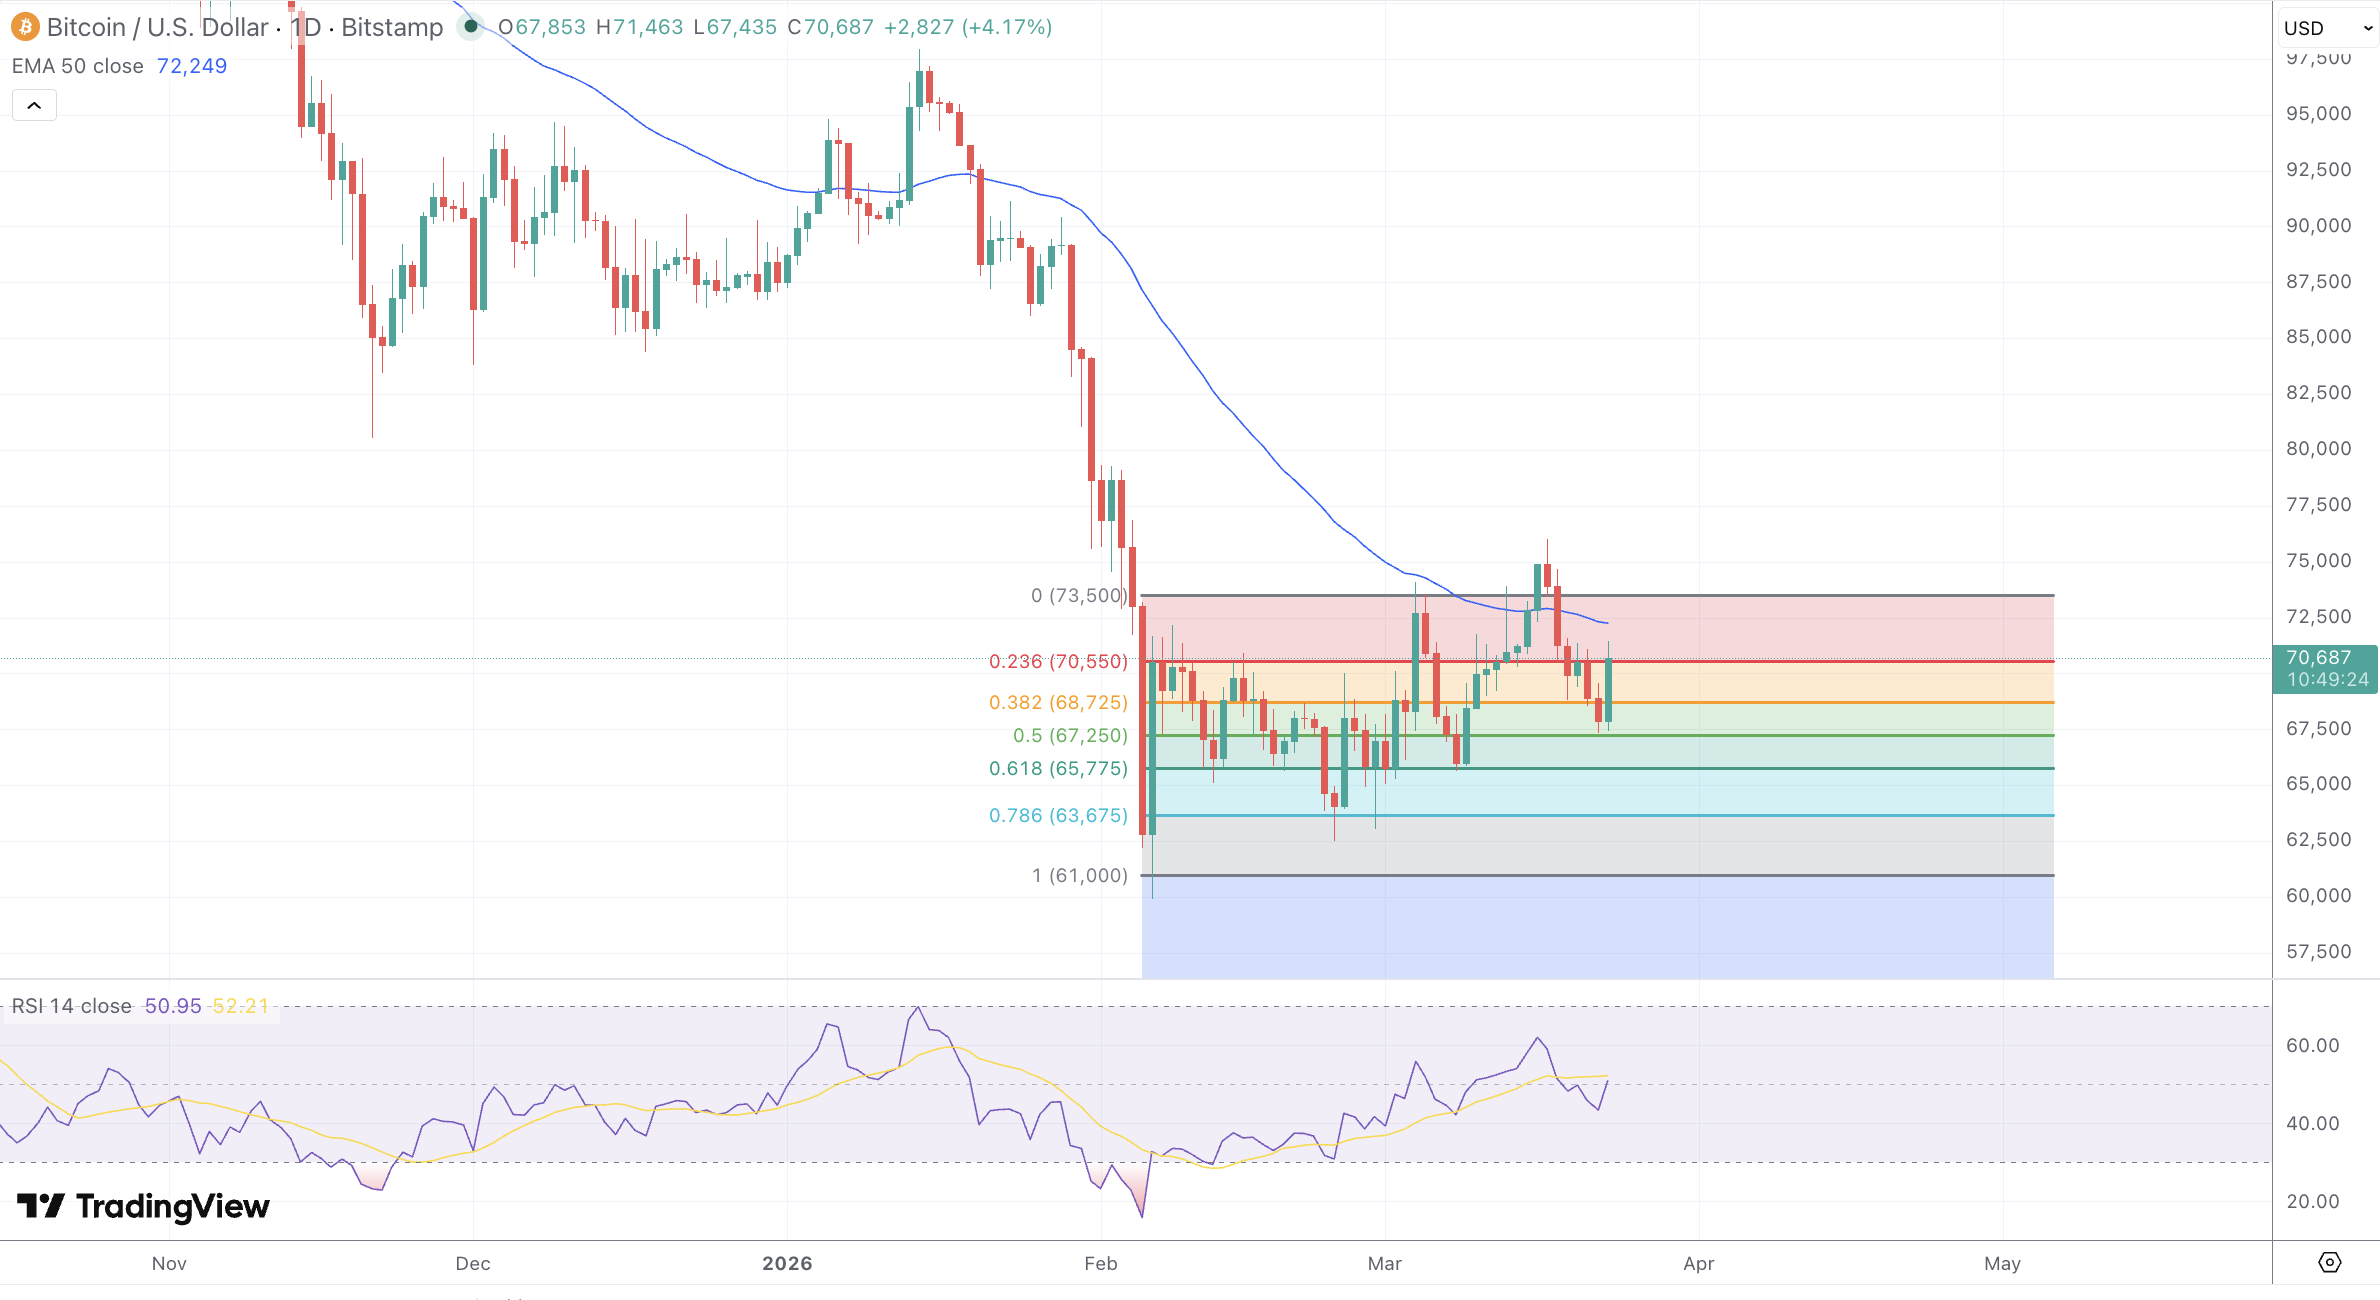
- BTC/USD trades around $70,303 on March 23, up 3.6% on the session, with an intraday high of $71,463 and a long upper wick signaling active resistance at the $71,300 to $73,300 cluster.
- RSI-14 is neutral at 50.05 signal / 52.14 fast line, removing the oversold bounce tailwind and requiring fresh buying conviction for continuation.
- The 50-EMA at $72,568 is the key weekly resistance; a daily close above opens the path to $78,000 to $80,000.
- Immediate support is the 38.2% Fibonacci retracement at $69,659; a close below $68,000 risks a retest of $65,000 to $63,000.
- Spot Bitcoin ETF AUM stands at $95.32 billion; three consecutive inflow weeks through March 13 were followed by a $1.4 billion single-day outflow on March 22, signaling institutional hesitation.
- Long liquidations spiked 154% to $125.89 million on March 22, adding forced selling pressure at the resistance zone.
- BTC’s 0.55 correlation with the S&P 500 keeps it exposed to Fed policy and the Iran conflict; resolution of geopolitical risk is the highest-probability short-term bullish catalyst.
- Base case for the week is consolidation between $67,000 and $73,000; the break will likely be driven by ETF flow data or a macro event.
- Medium-term targets of $85,000 to $90,000 require sustained ETF inflows, a dovish Fed pivot, and geopolitical stabilization.
Market Dynamics and Recent Performance
Bitcoin enters the week of March 24 trading at $70,303, having recovered from its cycle lows near $61,000 printed in mid-February. The March 23 session opened at $67,853, printed an intraday high of $71,463, and closed up 3.6% on the day, pushing BTC back above the $70,000 psychological threshold that has acted as both support and resistance throughout the consolidation.
The broader context matters. Bitcoin reached its all-time high near $126,000 in late 2025 and has since corrected approximately 44%, with five consecutive monthly declines including a 15% loss in February alone. The capitulation low near $61,000 triggered a short-squeeze recovery, and the current price reflects that bounce rather than a confirmed structural reversal. Market capitalization has recovered above $1.3 trillion with 24-hour volumes holding in the $33–38 billion range, while BTC dominance at 57.8% confirms capital is concentrating in Bitcoin rather than rotating into the altcoin complex. The Fear and Greed Index sits around 26, having briefly touched Extreme Fear at 12 earlier in the month, a reading that has historically preceded local bottoms though not always immediately.
Technical and Fundamental Influences
RSI-14 on the daily chart is printing 50.05 on the signal line and 52.14 on the fast line, having recovered from deeply oversold readings below 30 in February. The return to neutral removes the oversold bounce tailwind and places the burden of proof on the bulls. Price action over the past three weeks has built a base between $65,000 and $72,000, aligned with the highest on-chain accumulation density, where more than 400,000 BTC changed hands during the downturn. The $71,300 to $73,300 area is the first significant resistance cluster. A daily close above the 50-EMA at $72,568 opens the path toward $78,000 to $80,000, where the 100-day EMA provides more substantial overhead resistance. The 200-day SMA at $96,800 confirms the scale of technical repair still required.
Immediate support is the 38.2% Fibonacci retracement at $69,659, derived from the $61,000 low to the $73,500 bounce high. Below that, the $68,000 to $68,500 zone contains a cluster of short-term moving averages and prior pivot support. A daily close beneath $68,000 risks a retest of the $65,000 to $63,000 range, which aligns with the 61.8% Fibonacci retracement. Parabolic SAR dots have flipped below price following recent recovery candles, though the indicator remains sensitive to any failure to hold above $70,000. The 5-day EMA has crossed above the 50-day EMA, generating a preliminary buy signal, while ADX is declining from its downtrend highs, confirming that trend momentum is weakening into consolidation. Bollinger Bands have contracted sharply after the February expansion, signaling a compression breakout is approaching. OBV has turned modestly positive but has not yet confirmed accumulation at a scale sufficient to support a sustained new leg higher. The March 23 session itself printed a long upper wick at $71,463, reflecting active selling at the resistance cluster and suggesting the breakout attempt will require more than a single session to resolve.
On the fundamental side, Bitcoin’s 30-day rolling correlation with the S&P 500 sits at 0.55, keeping BTC firmly in the risk-on asset category and sensitive to Federal Reserve communication. The Fed held rates at its March 17-18 meeting, with traders pricing in two cuts through mid-2026, though geopolitical uncertainty around the Iran conflict has elevated oil and suppressed broader risk appetite. A ceasefire or de-escalation remains a cited catalyst for a sharp relief rally. U.S. spot Bitcoin ETFs recorded $767 million in net inflows for the week ending March 13, three consecutive positive weeks with BlackRock’s IBIT leading. Total ETF AUM stands near $95.32 billion. A single-day outflow of $1.4 billion on March 22 signals institutional hesitation at current levels, and long liquidations spiked 154% to $125.89 million on the same date, capping the rally. Cumulative net outflows since November 2025 total $7.8 billion, roughly 12% of AUM. On the constructive side, long-term holder selling has dried up and exchange-available BTC supply has fallen to levels last seen in 2019. Strategy’s $84 billion capital raise for Bitcoin acquisition and the potential U.S. Clarity Act passage remain structurally bullish catalysts pending execution.
Looking Forward
The week sets up as a binary test of the $70,000 to $72,568 range. A sustained daily close above the 50-EMA at $72,568 targets $73,300 initially and then $78,000 to $80,000, contingent on continued ETF inflows and macro stability. The bear case centers on a close below $68,000, which would expose the $65,000 to $63,000 area and the $62,900 structural low. Derivatives open interest has expanded 20.6% to $453 billion, creating leverage that could amplify a move in either direction. The most probable near-term outcome is continued consolidation between $67,000 and $73,000 until a macro catalyst resolves the directional ambiguity.
The medium-term picture is more constructive. Post-halving supply dynamics, growing institutional infrastructure, and exchange supply at cycle lows provide a structural demand floor absent in prior cycles. The base case for Q2 2026 is a wide re-accumulation range between $65,000 and $90,000, with medium-term targets of $85,000 to $90,000 achievable if ETF inflows re-accelerate and the macro environment stabilizes.
