

Key Takeaways
- Bitcoin closed Monday’s session at $76,836, down 0.74%, with the daily candle printing an open of $77,419, a high of $77,433, and a low of $76,509, confirming seller dominance from the open
- The True Market Mean (Optimised) indicator places the Primary TMM at $73,222 and the Alternative TMM at $76,617; price is currently resting directly on the Alternative line, the TMM Trend is Falling and Volatility is flagged as High, even as the broader Market Status reads Bullish with a deviation of +4.94% above the Primary TMM
- The 200-day SMA at $81,432 and the 200-day EMA near $82,000 form a dense resistance confluence sitting roughly $4,500 above current price
- RSI(14) has printed at 44.77, well below its signal line at 58.90, reflecting a bearish momentum cross that puts the neutral zone at risk
- Key downside support clusters between $74,200 and $75,109, while $78,182 is the first resistance the market must reclaim to stabilise
- Spot Bitcoin ETF inflows, which peaked at $2.44 billion in April, have decelerated to approximately $411 million so far in May, removing a key structural tailwind
- Institutional year-end targets from Franklin Templeton ($100,000) to Standard Chartered ($150,000) reflect longer-term conviction, but short-term technicals favour caution
Market Dynamics and Recent Performance
Bitcoin entered the week of May 18 under notable selling pressure, registering a close of $76,836 on Monday after a compressed intraday range between $76,509 and $77,433. The red close near session lows suggests sellers maintained control throughout, extending the pullback from Bitcoin’s recent recovery highs in the $83,000 to $84,000 region during the first half of May.
Bitcoin entered 2026 at elevated levels before collapsing from peaks near $97,000 to a February low of approximately $62,000, triggering widespread capitulation among leveraged participants. The subsequent recovery was driven by a surge in spot Bitcoin ETF demand. April emerged as the strongest month for U.S. spot Bitcoin ETF inflows in 2026, with cumulative net flows reaching $2.44 billion across nine consecutive days. BlackRock’s IBIT led the charge, attracting $335 million in a single session, while Fidelity’s FBTC contributed meaningfully alongside it. At the demand peak, ETF issuers were absorbing 4,500 to 5,000 BTC per day against a post-halving mining output of just 450 BTC, a 10-to-1 ratio that structurally drained exchange float and drove price toward $83,000. Total ETF net assets surpassed $108 billion, with corporate holdings from Strategy, MARA, and Metaplanet reaching 1.15 million BTC in Q1 2026, up 4.6% quarter-over-quarter.
May has told a different story. ETF inflows have decelerated to around $411 million month-to-date, with mid-May outflow episodes attributed to post-FOMC repositioning. Bitcoin’s market capitalisation stands near $1.52 trillion, and the Fear and Greed Index has retreated to 28, firmly in Fear territory.
Technical and Fundamental Influences
The daily chart presents a deteriorating short-term structure. The 200-day SMA at $81,432 and the 200-day EMA near $82,000 form a confluence resistance zone between $81,432 and $82,500. Bitcoin briefly traded above this band in early May before rejecting it, a meaningful technical failure. At $76,836, price sits approximately 5.5% below that zone with no immediate catalyst for recovery visible in the indicator stack.
The RSI(14) at 44.77 has crossed decisively below its signal line at 58.90. A continued decline into the 35 to 38 region would shift the oscillator toward trend-confirmation territory rather than a mean reversion setup. With RSI far from the oversold extremes reached in February’s low twenties, there is meaningful room to the downside before a technical exhaustion pattern becomes relevant.
The Bollinger Band structure places the upper band at $82,964, the lower band at $75,771, and the 20-period middle band at $79,367. Bitcoin is pressing toward the lower band without yet touching it. A close below $75,771 would open a test of the $75,109 structural support, while recovery through the middle band at $79,367 is a prerequisite for any bullish reengagement. The 5-day EMA has crossed below the 20-day EMA, adding short-term confirmation to the bearish RSI signal, while price remains beneath the 50-day, 100-day, and 200-day moving averages on the daily chart. Composite signal models reflect this alignment, with bearish readings outnumbering bullish ones nine to seven in short-term aggregation.
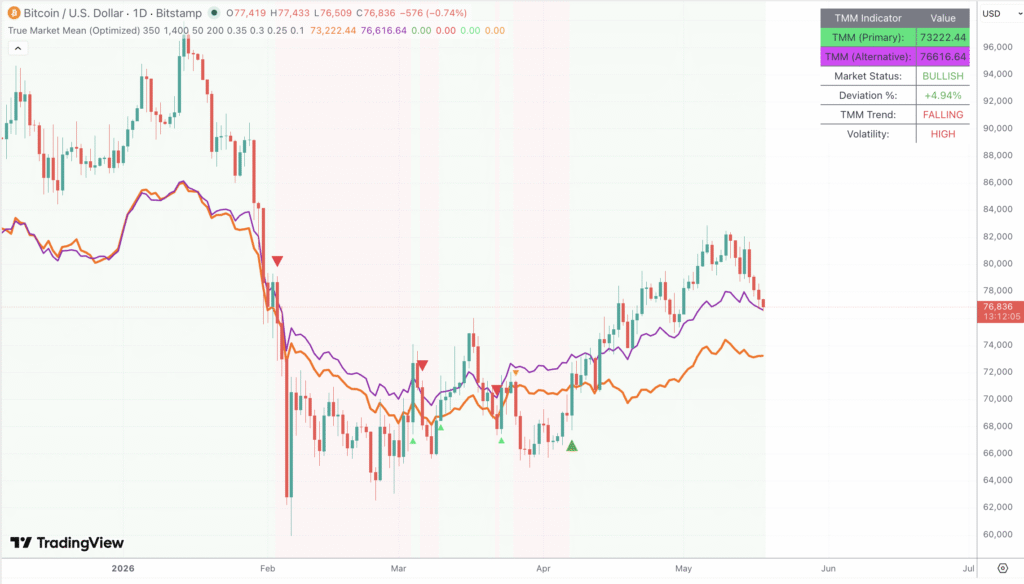
The True Market Mean indicator provides critical on-chain context. The Primary TMM, which tracks the long-term aggregate cost basis of the active market, sits at $73,222, while the Alternative TMM at $76,617 represents a shorter-cycle variant that price is currently pressing against almost exactly. The indicator flags a Falling TMM Trend and High Volatility, while the overall Market Status reads Bullish at a deviation of +4.94% above the Primary line. That combination is significant: the macro valuation framework still classifies Bitcoin as above its fundamental floor, but the declining trend and elevated volatility confirm that short-term momentum is deteriorating. Holding above the $76,617 Alternative TMM on a closing basis is now the immediate test; a sustained breach of that level would expose the Primary TMM at $73,222 as the next material on-chain support. Structural support is anchored at $75,109, with the 128-day moving average near $75,700 providing an additional defence layer and $74,200 representing the deeper floor. Resistance sits at $78,182, then $79,331, and the $81,432 to $82,500 confluence above. The recent sequence of lower highs from the $84,000 peak is consistent with distribution, and Monday’s inability to recover from the $77,433 high reinforces seller control.
Exchange reserves continue declining structurally, a medium-term positive, and post-halving supply dynamics remain intact with block rewards at 3.125 BTC, Bitcoin now 25 months into the cycle. However, the market historically enters a late-cycle correction phase at this juncture, and price behaviour since the $97,000 peak is broadly consistent with that pattern. Bitcoin’s 90% correlation with the S&P 500 keeps it exposed to macro risk-off episodes, while progress on the CLARITY Act and BNY Mellon’s Bitcoin custody expansion into Abu Dhabi offer incremental longer-term support to the structural thesis.
Looking Forward
The week’s directional outcome hinges on whether Bitcoin can hold the Alternative TMM at $76,617 and the broader $75,109 to $76,000 support corridor. A daily close below $76,617 would confirm a breach of a key on-chain support level and signal that bears are pressing toward the $74,200 to $75,109 structural floor, with the Primary TMM at $73,222 the next significant on-chain line below. An RSI recovery toward the 58.90 signal line is needed to confirm any genuine stabilisation attempt.
For a constructive scenario, Bitcoin must reclaim $78,182 with decisive daily closes, clear $79,331, and then target the 200-day SMA at $81,432, above which upside toward $83,000 to $85,000 becomes credible. Institutional year-end base cases in the $85,000 to $90,000 range require ETF inflows to resume alongside accommodative Federal Reserve conditions in the second half of 2026.
ETF flow data this week is the primary catalyst to watch. A return above $200 million in daily inflows would signal rebuilding institutional conviction. Continued outflows or flat data would remove the key fundamental driver behind the May advance and leave price exposed to further selling. With the Fear and Greed Index at 28, positioning is already skewed defensively, setting up the conditions for a sharp recovery once a trigger materialises. Until that trigger appears and Bitcoin reclaims $78,182 above the 20-day moving average, the path of least resistance on the daily chart remains toward the Alternative TMM at $76,617 and the $74,200 to $75,109 support zone below it.


