
Key Takeaways
- XAU/USD settled at $4,543 after shedding more than 3% across the prior week, printing a session low of $4,480 before partial stabilisation
- April CPI surged to 3.8% year-over-year, the hottest reading since May 2023, while April PPI posted its largest monthly gain since early 2022, collectively crushing remaining hopes for Fed easing in 2026
- RSI(14) reads 39.66 on the daily chart, trading below its signal line at 45.20, confirming sustained bearish momentum without yet reaching oversold territory
- The 200-day SMA sits at $4,348, providing the last major structural floor should near-term supports at $4,479 and $4,351 give way
- FOMC minutes on May 20, flash PMIs and jobless claims on May 21, and University of Michigan inflation expectations on May 22 are the week’s defining macro catalysts
- Global gold demand reached a record 1,230.9 tonnes in Q1 2026 per World Gold Council data, with bar and coin demand surging 42% year-over-year to 474 tonnes
- India’s decision to raise gold import tariffs from 6% to 15% introduces a fresh demand headwind from the world’s second-largest consumer of the metal
Market Dynamics and Recent Performance
Gold entered the week of May 18 under sustained pressure from a resurgent US dollar, rising Treasury yields, and an inflation regime that has firmly shut the door on Federal Reserve rate cuts for 2026. Monday’s daily candle opened at $4,545, tested a low of $4,480, and closed at $4,543, a gain of just $2.64 that reflects consolidation rather than recovery.
The prior week’s decline was triggered by the April CPI release, showing headline inflation accelerating to 3.8% year-over-year, above the 3.7% consensus and March’s 3.3% reading. Core CPI came in at 2.8% annually, above the 2.7% estimate. Gasoline costs rising 28.4% year-over-year, driven by the US-Iran conflict and disruption of Strait of Hormuz shipping, bore the brunt of the upside pressure. April PPI amplified the message, posting its biggest monthly jump since early 2022. Inflation has climbed 1.4 percentage points in two months, a trajectory JPMorgan Global Research expects to keep headline CPI above 3% well into early 2027.
The monetary policy consequences were swift. CME FedWatch data showed approximately 30% of participants pricing in a rate hike by December 2026, a probability climbing above 70% when extended to April 2027. With the federal funds rate at 3.50%–3.75% and only 2.6% expecting a June cut, the opportunity cost of holding non-yielding gold has risen sharply. The 10-year Treasury yield climbed to 4.457% in the wake of the data. India’s simultaneous decision to raise gold import tariffs from 6% to 15% added a demand headwind, while confirmation of Kevin Warsh as incoming Fed Chair introduced further institutional uncertainty. Gold closed the prior week down roughly 4% and has shed approximately 5.2% over the past four weeks, though it remains 42% higher year-over-year.
Technical and Fundamental Influences
XAU/USD is operating in a structurally weakened posture across the daily timeframe. Price sits below the 20-day SMA at $4,686, the 50-day SMA at $4,617, and the 100-day SMA near $4,785. Only the 200-day SMA at $4,348 remains below current price, its rising slope the lone moving average still constructive on a long-term basis. Across the broader complex, 10 of 12 major MA crossings signal selling pressure from the 5-day through the 100-day periods.
The RSI(14) at 39.66 trades 5.5 points below its signal line at 45.20, confirming a bearish momentum flip rather than a simple deceleration. The indicator has not breached the 30 level that marks oversold territory, leaving room for further deterioration before exhaustion signals appear. The MACD line at approximately -25.02 sits firmly below its signal line with the histogram in negative territory and the two lines diverging further, ruling out an imminent bullish crossover without a sustained price recovery first.
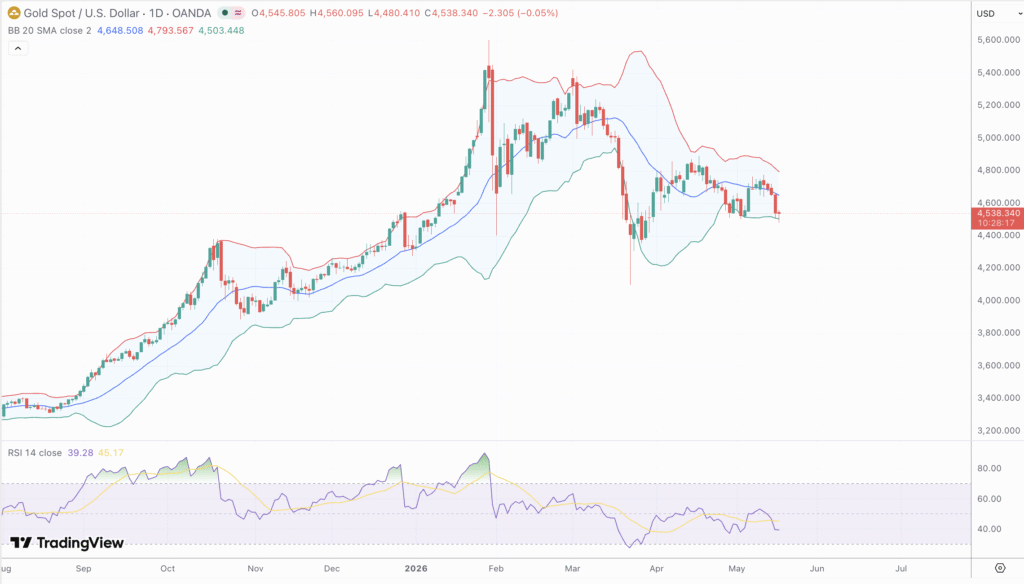
Fibonacci retracement analysis from the 52-week low at $3,204 to the January 2026 all-time high at $5,595 places the 0.618 level near $4,732, which has capped multiple recovery attempts in recent weeks and coincides with the descending trend line and 100-day SMA resistance cluster. The 0.786 retracement near $4,503 sits in immediate proximity to current price, making the $4,500 handle a near-term pivot. A sustained close below it opens the 0.786-to-1.0 retracement zone between $4,351 and $4,306, aligning with the key horizontal support levels. Bollinger Bands are contracting after the CPI-driven expansion, a setup that typically precedes a directional breakout. Parabolic SAR dots remain above price in a bearish configuration, requiring a daily close above $4,586–$4,610 before any flip to bullish. ADX holds a moderate reading with the negative DI comfortably above the positive DI. ATR remains elevated following last week’s range expansion, and On-Balance Volume continues to trend lower through the correction, indicating distribution rather than accumulation at current levels.
Key resistance levels are $4,560–$4,580, $4,610, and the 50-day SMA at $4,617, with the primary medium-term ceiling in the $4,655–$4,686 zone where the 100-day and 20-day SMAs have repelled advances three times in recent weeks. On the downside, $4,479 aligns with the descending trend line from the January highs, followed by $4,351 and $4,306, with the 200-day SMA at $4,348 acting as confluence support.
The fundamental picture remains a tug-of-war between structural demand and acute monetary headwinds. Central bank purchases from institutions across Asia and the Middle East continue to provide a floor, and WGC Q1 2026 data confirms that physical demand remains historically elevated. Geopolitically, US military briefings on potential Iran operations and an ongoing naval blockade keep a risk premium embedded in the price, though the Trump-Xi summit in Beijing has not produced the systemic shock that would drive an aggressive flight-to-safety bid.
Looking Forward
The week ahead is event-heavy and directionally decisive. FOMC minutes on May 20 will reveal the depth of hawkish conviction within the committee and whether rate-hike language has become a consensus framing rather than a fringe position. Hawkish minutes would push real yields higher and extend gold’s decline; a more balanced read would offer relief, though it would need accompanying CPI softness to reverse the trend. May 21 brings initial jobless claims and flash PMIs for manufacturing and services. A deterioration in either reading would sharpen the stagflation narrative, theoretically gold-positive but near-term ambiguous given that rate-cut expectations have already been priced out. May 22’s University of Michigan inflation expectations survey functions as a gauge of whether the public’s long-term inflation psychology is becoming unanchored. A hot reading would add fresh rate-hike pressure; a soft one would be the most constructive outcome for bulls.
For a meaningful recovery, XAU/USD needs to close above $4,586–$4,610 to recapture Fibonacci and EMA confluence. The more probable near-term path, given the bearish MA alignment, negative MACD, and RSI below its signal line, is continued range-bound pressure with a downside bias, testing $4,479 and potentially extending to $4,351 should that level fail on a closing basis. The 200-day SMA at $4,348 is the structural anchor that dip-buyers are expected to defend aggressively. The longer-term thesis remains intact: central bank accumulation, persistent geopolitical risk, and a Fed unable to cut without reigniting inflation support year-end forecasts of $5,400–$6,000. Near-term, however, the path to those levels requires either a dovish pivot in rate expectations or a fresh macro shock that does not yet appear imminent.


