Key Takeaways
- Gold is trading at multiyear highs and remains biased to the upside as market pricing for U.S. rate cuts, heavy ETF inflows, and central bank purchases underpin demand.
- Technical structure is bullish but shows mixed momentum on shorter timeframes; expect volatility within the $4,100–$4,350 range unless a major macro surprise occurs.
- Immediate support cluster: $4,100–$4,150. Secondary support: $4,000. Immediate resistance cluster: $4,300–$4,350; a clean break would target $4,400+.
- Watch daily ATR, 20-period EMA, RSI and MACD for trend confirmation or early signs of exhaustion. Also monitor fresh ETF flow prints and any shifts in central bank buying.
Market Dynamics and Recent Performance
Gold continues to trade at historically elevated levels after a prolonged rally that pushed spot prices into the mid-four-thousand dollar range. Intraday action this week has shown the metal holding above previous resistance bands while daily ranges have widened, reflecting a combination of safe-haven buying and momentum chasing. The uptrend has been fuelled by a softer dollar backdrop, very strong inflows into gold exchange-traded funds year to date, and elevated expectations for U.S. policy easing. Traders have also reacted to renewed geopolitical friction between major economies, which has strengthened demand for non-yielding assets.
Despite the bullish backdrop, price action has not been one directional. Intermittent profit taking and short corrections have formed consolidation ranges around recent breakout zones. That behavior suggests the market is alternating between trend continuation and short retracement as participants digest macro releases and positioning flows.
Technical and Fundamental Influences
From a technical standpoint, the structure remains skewed toward the upside, but the breadth of indicators is showing mixed signals across timeframes. On shorter intraday frames, momentum oscillators and community technical ideas show evidence of overbought readings and compressed ranges that typically precede either quick pullbacks or a volatility expansion break. On the daily frame, the official technical summary readings are still weighted to buys, with moving averages aligned in bullish order and trend measures signalling strength. Average true range on the 14-day window indicates elevated but not extreme daily volatility, so intraday swings are meaningful but not wildly unstable.
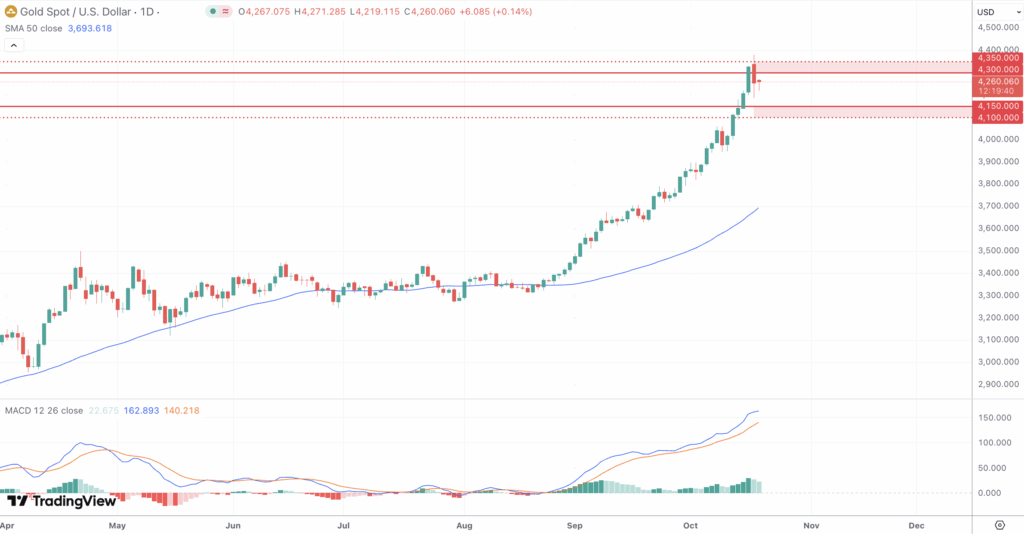
Concrete zones to watch are as follows. Immediate technical support sits around the $4,100–$4,150 area; a secondary support cluster lies near $4,000, which has historical significance and would be a deeper corrective target if momentum fades. On the upside, near-term resistance is clustered in the $4,300–$4,350 band; a convincing, sustained break above that region opens the path toward $4,400 and higher measured-move targets. Intraday pivot ranges observed on futures and CFD feeds show the market oscillating inside a $40–$80 daily footprint recently, so expect meaningful moves but contained within those technical windows unless a macro surprise arrives.
Key fundamental drivers remain firmly in place. The pricing of a near-certain rate cut from the Federal Reserve has reduced the opportunity cost of holding gold, lifting net long interest across investor segments. Central bank accumulation has also been a steady buyer of the metal this year, tightening available supply on the market and supporting higher price floors. Meanwhile, ETF flows continue to be robust, adding a structural buyer that has amplified rallies and made corrections shallower on average. That combination of dovish rate expectations, official sector buying, and large investor inflows forms the primary bullish case. Should inflation surprise higher or the U.S. dollar unexpectedly rebound, the platinum path would be reversed and gold could surrender some of the recent advance.
Looking Forward
For the coming week, two practical scenarios stand out. In the base case, gold grinds higher as market participants price in central bank easing and await macro prints that undercut rate-cut uncertainty. In that environment, expect tests of the $4,300–$4,350 resistance zone and, if momentum persists, extensions toward $4,400. Traders should watch momentum confirmation on breakouts, such as expanding volume on higher closes and rising MACD histograms on the daily chart.
In the alternative scenario, a stronger than expected set of U.S. macro data or a sharp dollar bounce could trigger a corrective leg. The first real line of defense is the $4,100–$4,150 zone; a violation there would expose $4,000 as the next major structural support. In a corrective phase, expect RSI divergence on hourly and daily charts and a fall in ETF net inflows that would accelerate selling. Intraday traders should use clear pivots for risk management: keep stops outside the opposite side of the breakout candle, and adopt scaled entries on pullbacks into well-defined support bands.
Technically minded traders will want to watch a few measurable items this week. First, the 14-period ATR on daily bars gives a sense of the normal move to size risk. Second, use the 20-period exponential moving average on the daily chart to track whether pullbacks remain shallow buys or morph into trend breaks. Third, watch for divergence between price highs and indicators like RSI or MACD; persistent divergence often signals weakening momentum even in strong trends. Finally, monitor futures positioning and reported ETF flows overnight for signs of either exhaustions in long positions or fresh accumulation.