
Key Takeaways
- Bitcoin currently trading at $86,540 after “Sunday slam” liquidated $400 million in leveraged longs; intraday low reached $85,945
- November marked BTC’s worst monthly performance since 2022, with prices down approximately 32% from the October all-time high of $126,198
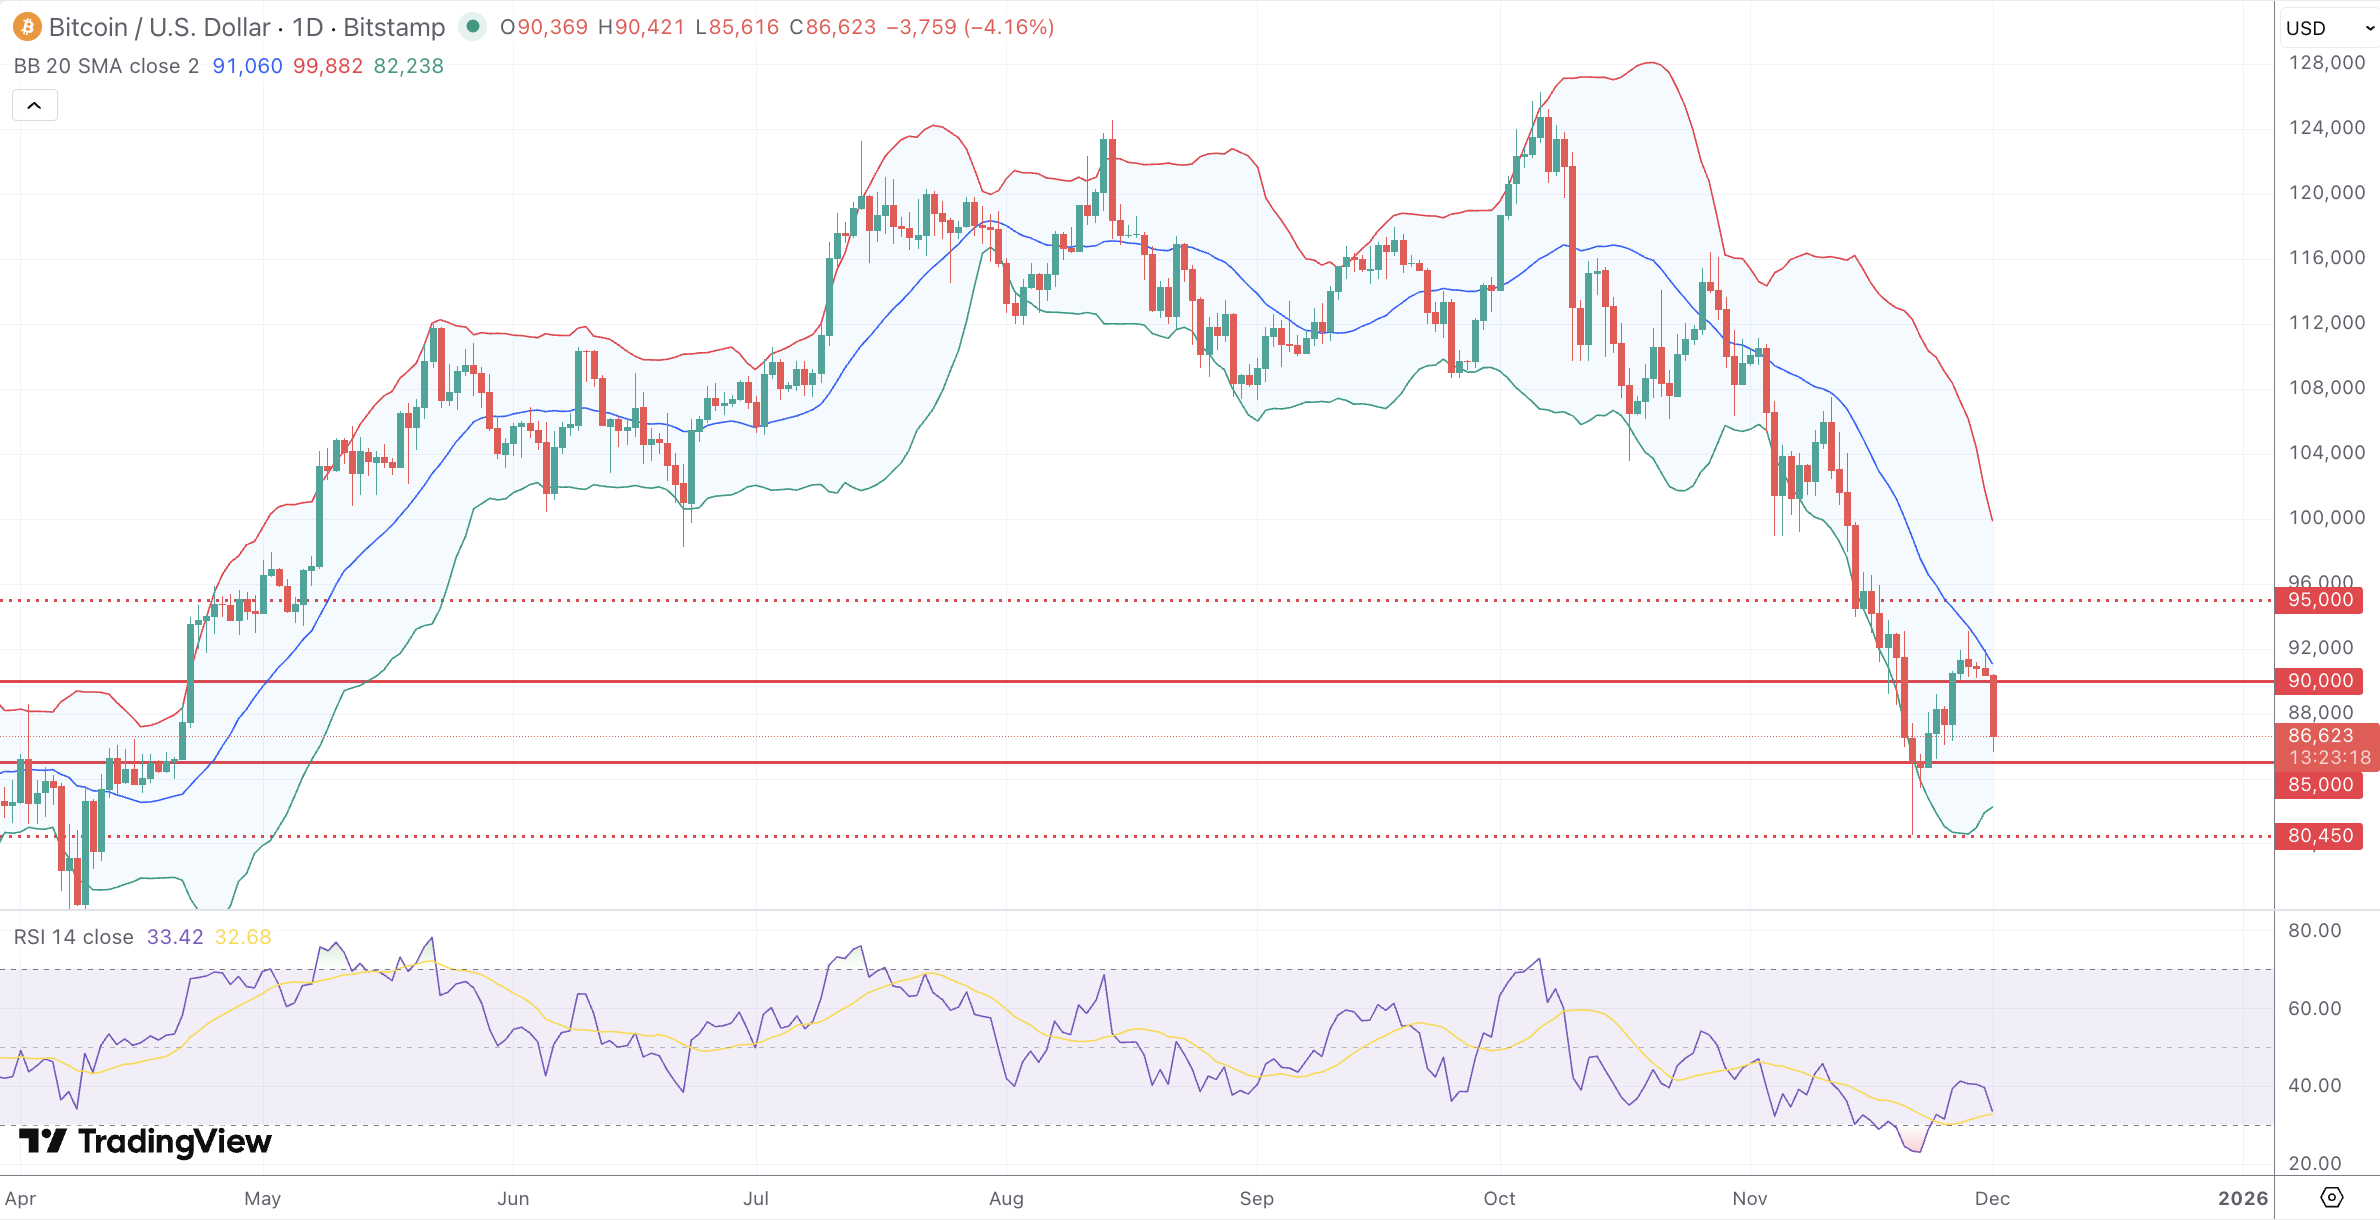
- Fear and Greed Index at 28 indicates “Fear” sentiment; RSI at approximately 34 approaching but not yet at oversold extremes
- Key support levels: $84,000-$86,000 (immediate), $80,400-$80,500 (critical structural), $78,000 (breakdown trigger), $75,000-$76,322 (52-week low zone)
- Key resistance levels: $88,690-$90,330 (minor), $92,500 (major psychological), $97,100-$101,156 (critical resistance cluster), $98,300 (55-week EMA)
- Spot Bitcoin ETF outflows reached $3.45 billion in November, the worst month since January 2025 launch
- Fed rate cut probability at approximately 87% for December 9-10 meeting; Powell speech today in focus
- Technical outlook remains bearish short-term with BTC trading below all major moving averages; projected December range of $80,400-$97,100
Market Dynamics and Recent Performance
Bitcoin enters December under significant pressure, with the flagship cryptocurrency currently trading at $86,540 following a dramatic “Sunday slam” that saw nearly $400 million in leveraged long positions liquidated within a single hour. The world’s largest digital asset crashed to an intraday low of $85,945 during early Asian trading on Monday before staging a modest recovery, though sentiment remains fragile as traders assess the damage from November’s brutal correction.
The scale of the recent decline has been staggering. Bitcoin has shed approximately $800 billion in market capitalization since reaching its 2025 peak of $126,198 in early October, representing a drawdown of roughly 32% from those highs. November marked the cryptocurrency’s worst monthly performance since the turmoil of 2022, when a series of corporate collapses sent shockwaves through the digital asset sector. The month saw Bitcoin register only 13 out of 30 green days, with price volatility reaching 8.23% over the 30-day period.
The overnight decline of more than 6% came without an obvious news catalyst, exposing how fragile current market liquidity remains. Trading volume surged 46% to approximately $55 billion in the past 24 hours as panic selling cascaded through thin weekend order books. This type of aggressive move has become a recurring pattern throughout 2025, with Friday night and Sunday night sessions frequently producing outsized swings as market makers step back and leverage becomes the dominant force.
The recent sell-off has stripped away virtually all of Bitcoin’s gains for 2025. After beginning the year just above $94,000 and enjoying a crypto-friendly boost following President Trump’s inauguration, Bitcoin surged past $100,000 for the first few months before succumbing to broader risk-off sentiment. The April tariff announcements triggered an initial correction that took prices to $76,000, followed by a recovery that culminated in the October all-time high. However, the subsequent decline has been relentless, with each bounce producing weaker highs and failing to recapture key technical levels.
Total cryptocurrency market capitalization has dropped below $3 trillion to approximately $2.95 trillion, with more than $130 billion evaporating in the recent leverage flush alone. The decline has been particularly pronounced during U.S. trading hours, a pattern that has persisted for several weeks and underscores the influence of institutional positioning on price action.
Technical and Fundamental Influences
From a technical perspective, Bitcoin presents a challenging picture across multiple timeframes. The cryptocurrency is exhibiting weak development within a falling trend channel in the short term, with declining buy interest among investors. At the current price of $86,540, BTC is trading below all major moving averages, with the 7-day Simple Moving Average at $89,603, the 20-day SMA at $91,069, and the 50-day SMA positioned higher still. This configuration confirms the bearish near-term trend structure and suggests rallies will face persistent overhead resistance.
The Relative Strength Index (RSI) has plunged to approximately 34 on the 14-day reading, approaching oversold territory but not yet reaching the extreme levels below 30 that typically precede capitulation bounces. The daily chart shows momentum remaining firmly negative, with the MACD in bearish territory.
Bitcoin’s position at 0.21-0.25 within the Bollinger Bands indicates the price is trading near the lower band at approximately $82,000, a level where rebounds have historically materialized. The bands themselves show expansion, reflecting the increased volatility that has characterized recent trading sessions. The daily Average True Range reading of approximately $3,963 confirms elevated volatility conditions that could produce sharp moves in either direction.
Key support and resistance levels have been clearly defined through the correction. At the current price of $86,540, immediate support rests in the $84,000-$86,000 zone, with more substantial structural support at $80,400-$80,500. This critical level has been repeatedly tested and defended, and a breach would likely trigger accelerated selling. The high-volume node in the $83,000-$84,000 area provides additional support, while a clean break below $78,000 would expose the $75,000-$76,322 zone representing the 52-week low. Further downside would target the 2024 consolidation range between $69,000 and $72,000.
Overhead resistance has stacked considerably following the correction. The first meaningful barrier appears at $88,690-$90,330, representing a minor support-turned-resistance band that must be reclaimed for any sustained bounce. More significant resistance clusters around $92,500-$92,734, with the critical zone between $92,734 and $101,156 representing what analysts describe as the most important resistance area of 2025. The 55-week Exponential Moving Average near $98,300 has provided firm support throughout previous bull cycle phases but now represents formidable overhead resistance after BTC slipped below it for the first time this cycle.
Fundamental drivers have turned decidedly negative in recent weeks. U.S. spot Bitcoin ETF outflows reached approximately $3.45-$3.7 billion in November, marking the worst month for the products since their January 2025 launch. This represents a dramatic reversal from the previous two months, which saw combined inflows of $6.9 billion. The ETF dynamic introduces a structural vulnerability, as institutional sponsors must sell Bitcoin to meet redemptions regardless of price levels, potentially accelerating any downturn when sentiment sours.
The macro backdrop has deteriorated from Bitcoin’s perspective. The Federal Reserve’s December rate decision has become a focal point, with expectations shifting dramatically throughout November. At the beginning of the month, traders assigned a 90% probability to a December rate cut, but this swung to as low as 45-50% before recovering to approximately 87% following recent dovish Fed commentary. This uncertainty has contributed to persistent weakness during U.S. trading hours as crypto markets become increasingly correlated with traditional risk assets.
The prolonged U.S. government shutdown has exacerbated market stress by draining liquidity and delaying crucial economic data releases. Additionally, Trump’s renewed tariff threats against China, including a potential 155% levy, have added another layer of uncertainty weighing on global risk sentiment. Traders are now cautiously awaiting Fed Chair Powell’s commentary later today, which could shape expectations for the upcoming FOMC meeting.
Looking Forward
The week ahead brings several critical catalysts that could determine Bitcoin’s near-term trajectory. Monday features November’s ISM Manufacturing PMI and a speech from Fed Chair Powell, though Powell is not expected to discuss monetary policy given the Fed’s blackout period ahead of the December 9-10 meeting. Tuesday brings September’s JOLTS Job Openings data, followed by a busy Wednesday with November’s ADP Nonfarm Employment, S&P Global Services PMI, and ISM Non-Manufacturing PMI. Thursday sees Initial Jobless Claims data, while Friday concludes with September’s PCE Inflation and December’s Michigan Consumer Sentiment reading.
The Fear and Greed Index currently sits at 28, indicating “Fear” among market participants, a substantial decline from the elevated readings seen during Bitcoin’s run toward $126,000. While extreme fear has historically preceded major bottoms, the current reading has not yet reached the “Extreme Fear” territory below 20 that typically signals true capitulation. Market structure analysis suggests the downside liquidity has been largely cleared through today’s correction, with approximately $400 million in long liquidations already absorbed.
Conversely, nearly $2 billion in short positions are concentrated between current levels and $92,500, while $13 billion sits above up to $103,000. This positioning could fuel a short squeeze if Bitcoin manages to break above immediate resistance with conviction. The CME gap has already closed following Monday’s decline, and analysts note that clearing downside liquidity first often sets the stage for a base formation.
For December, the market appears poised for one of two scenarios. The bullish case requires BTC to reclaim the $92,500 level from current prices at $86,540, which would represent an approximate 7% gain and likely attract momentum buyers. A Fed rate cut on December 9-10 could provide the catalyst for such a move, as lower rates typically boost liquidity and drive investors toward risk assets. If bulls can clear $92,500 and push toward $100,000, the path would open for a potential retest of the October highs by early 2026.
The bearish scenario envisions continued deterioration below the $80,000 support level, which would likely trigger a cascade toward the $75,000-$76,000 zone and potentially the 2024 consolidation range between $69,000 and $72,000. This outcome becomes more probable if ETF outflows persist, the Fed surprises hawkishly, or broader risk assets continue to deteriorate. Some analysts suggest the four-year cycle high may have already occurred in October, though this remains a minority view.
The most probable outcome for December may be sideways consolidation within the $80,000-$92,500 range as the market digests the November correction and awaits clearer signals on Fed policy and institutional demand. The preference for many traders is to see the market stabilize with gradually increasing volume before committing to directional positions.
