
Key Takeaways
- BTC/USD is trading at $68,347 on March 9, up 3.60% on the day, but approximately 46% below its October 2025 all-time high of $126,000, with the weekly trend bearish across all major moving averages.
- The daily RSI 14 has recovered from a historic low of 25.6 to 47.72 (signal line 44.04), forming an early bullish cross in neutral territory, though the weekly RSI remains structurally depressed.
- The daily MACD histogram is positive at +608 and expanding; a bullish crossover of the MACD line (-4,014) above the signal line (-4,621) this week would be a meaningful confirmation signal.
- Key resistance sits at the 200-day EMA near $68,658, then $70,147, $70,906, and $74,437; critical support levels are $65,413, $62,918, and the major $60,000 structural floor.
- The U.S. CPI release on March 11 and the Fed meeting on March 17–18 are the week’s defining macro catalysts; an upside inflation surprise would likely cap any recovery attempt.
- Spot Bitcoin ETFs have seen over $9.1 billion in cumulative outflows since November; a sustained shift to weekly net inflows alongside a MACD crossover and RSI holding above 50 would form the first credible technical case for a recovery phase.
Market Dynamics and Recent Performance
Bitcoin opened the first week of March at $65,774, surged to a high of $74,083 on March 4, then retreated to close the week near $68,000. As of March 9, BTC/USD is trading at $68,347, up 3.60% on the day with an intraday range of $65,844 to $68,583. At current levels, Bitcoin remains roughly 46% below its all-time high of $126,000 reached in October 2025.
The broader backdrop remains deeply risk-off. A sharp deterioration in the U.S. labor market, with 92,000 jobs shed in February against expectations of a 50,000 gain, has rattled confidence across risk assets. This jobs shock, compounded by geopolitical tensions and oil above $90 per barrel, has amplified selling pressure on Bitcoin. Spot ETFs have recorded cumulative outflows exceeding $9.1 billion since November, reflecting four consecutive months of net redemptions as institutional allocators reduce exposure to high-beta risk assets.
The Fear and Greed Index sits at 12, firmly in Extreme Fear territory. BTC dominance is near 57.5%, and the March 4 volume spike to $40 billion, roughly 150% above average, did not translate into a sustained recovery, reinforcing the near-term bearish bias.
Technical and Fundamental Influences
The technical picture remains bearish at the macro level, with tentative short-term recovery signals beginning to emerge. Price is trading below all five key EMAs (10, 20, 50, 100, and 200-day). The 50-day MA sits near $70,147 and the 200-day EMA at $68,658, both acting as overhead resistance. Today’s intraday high of $68,583 tested the 200-day EMA zone before finding sellers, making a clean daily close above $68,658 a critical near-term trigger. Reclaiming the $70,000–$70,580 zone would be the first meaningful bullish structural signal.
The daily RSI 14 reads 47.72, with its signal line at 44.04. The RSI line is above its own signal, forming a mild short-term bullish cross after recovering from a historic low of 25.6 during the February selloff, only the third time in Bitcoin’s history the 14-day RSI has fallen below 30. The current reading places price in the neutral zone with room in either direction, though the weekly RSI, which dipped as low as 27, indicates the broader recovery is still in its early stages.
The daily MACD (12,26,9) is generating its most constructive signal in months. The histogram prints at +608, positive and expanding, while the MACD line sits at -4,014 and the signal line at -4,621. The widening histogram confirms that short-term selling pressure is fading. A bullish crossover of the MACD and signal lines could materialize within this week’s sessions given the pace of convergence. On the weekly timeframe, however, the MACD bearish crossover remains the dominant structural read.
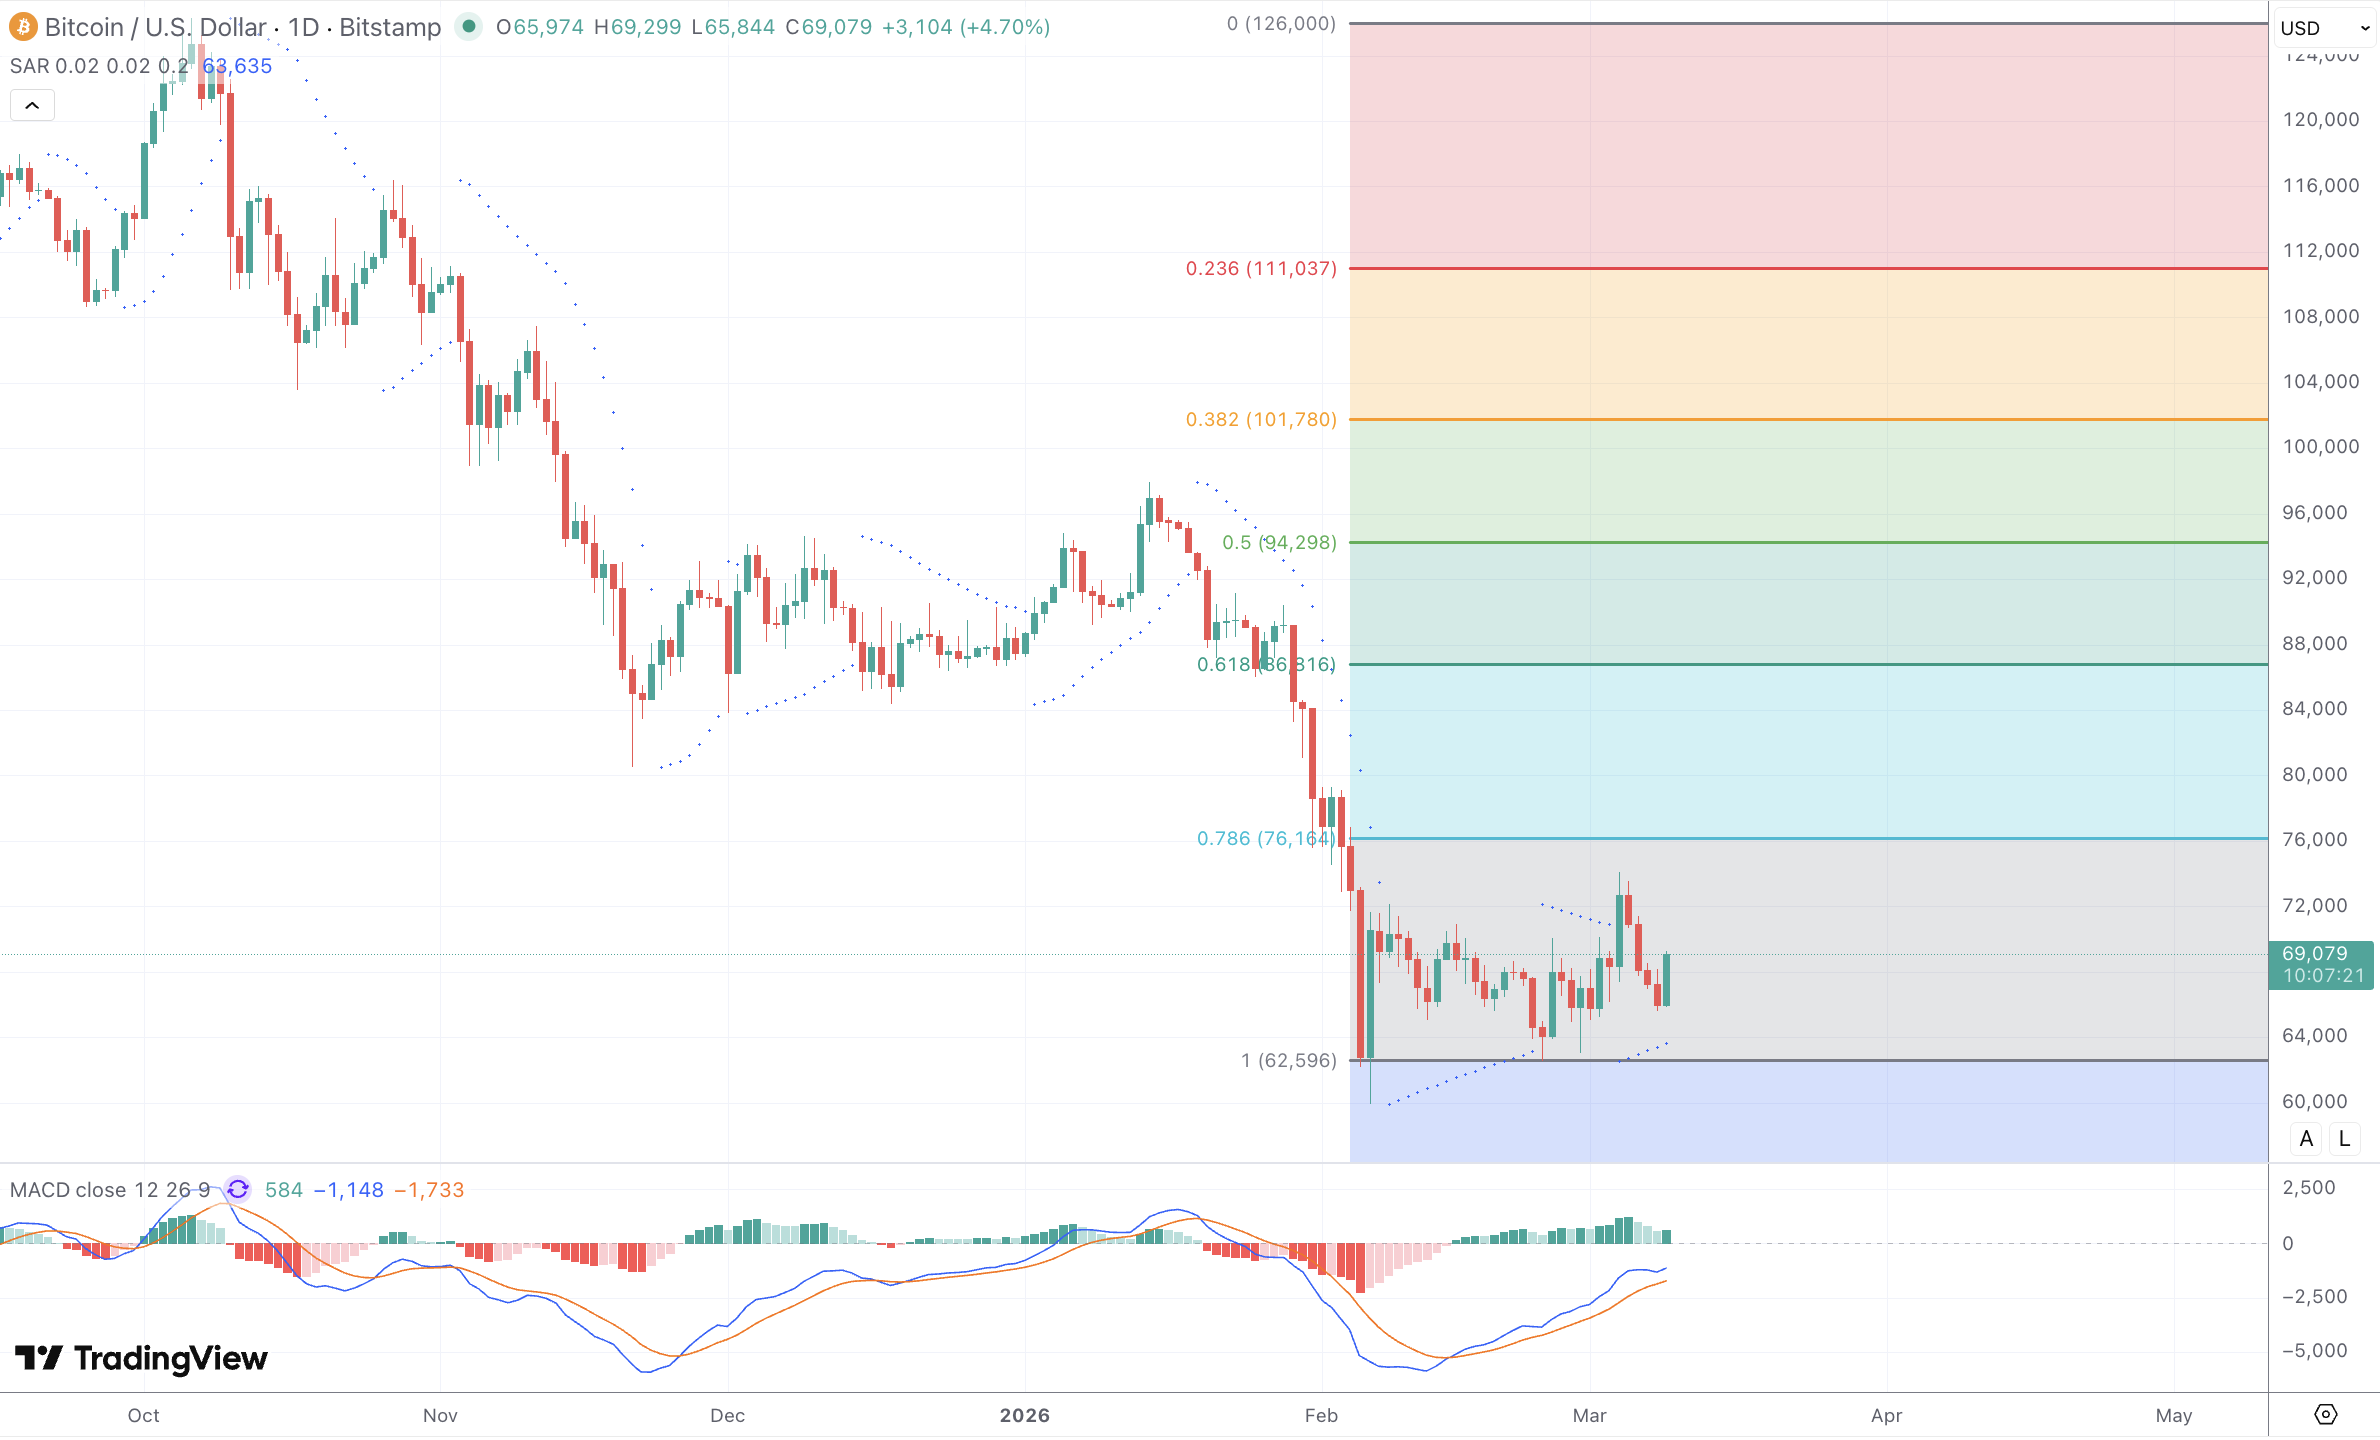
The Fibonacci retracement grid drawn from the $126,000 all-time high to the $62,596 cycle low tells a sobering story about how far the correction has run. Current price near $67,966 is trading between the 0.786 retracement at $76,168 and the full 1.0 level at $62,596, meaning Bitcoin has retraced more than 78.6% of its entire prior bull run. The immediate recovery targets to the upside are the 0.786 level at $76,168, followed by the 0.618 at $86,816, the 0.5 midpoint at $94,298, and the 0.382 at $101,780. Each of these levels represents a significant overhead hurdle and a likely area of supply. The Parabolic SAR is currently printing at 62,758, sitting below current price, which is a bullish signal on the daily timeframe, indicating that the short-term trend has flipped in favor of buyers. This is a meaningful change from the prior bearish SAR configuration and supports the case for a near-term recovery attempt. ADX near 25 reflects moderate rather than extreme trend strength, consistent with distributional consolidation, and ATR remains elevated, pointing to continued intraday volatility.
Key levels to monitor: resistance is clustered at $68,683, $70,906, and $74,437. A daily close above $71,700 would invalidate the current lower-high structure. On the downside, $65,413 is the critical near-term floor, followed by $62,918 and the major $60,000 level where the heaviest put open interest is concentrated. A break of $60,000 opens the path toward $55,000 and potentially $50,000. OBV is showing mild positive divergence, consistent with on-chain data showing whale wallets accumulating roughly 230,000 BTC since late December, pushing large-holder totals to approximately 3.09 million BTC.
On the fundamental side, the Fed meeting on March 17–18 is the most important near-term catalyst. Markets price approximately a 50% probability of a June rate cut, but oil above $90 and weak jobs data create a near-stagflationary constraint that limits the Fed’s room to ease. The U.S. CPI release on March 11 will set the tone for the week: an upside inflation surprise would cap any recovery attempt, while a softer print could generate a tactical bounce. President Trump’s endorsement of the Digital Asset Market Clarity Act remains a long-term structural positive, but the bill is moving slowly through Senate negotiations and its near-term impact has faded. ETF redemptions show signs of slowing, with a $1.15 billion buying wave recorded between March 2–4, though $577 million in late-week outflows partially offset those gains.
Looking Forward
The week of March 9–16 sets up as a binary around the $65,000–$68,000 support band. A benign CPI print on March 11, combined with Bitcoin holding current support, could trigger a recovery attempt toward $71,700 and potentially $74,437 if momentum builds. Futures open interest has declined 19.7% from $61 billion to $49 billion, meaning the market is less crowded and a short squeeze could amplify any upside move.
The bullish case requires the weekly RSI to hold its floor, a dovish lean from Fed communications, and ETF outflows decelerating to neutral. A reclaim of $76,168, the 0.786 Fibonacci retracement, on volume would be the first credible sign the correction is maturing, with the 0.618 level at $86,816 as the next meaningful target beyond that. The bearish case is structurally stronger: all major moving averages sit above price, the weekly MACD remains in bearish crossover, and the macro environment offers little near-term fundamental support. A break of $65,000 opens the path to $60,000, and a decisive break there risks a cascade toward $55,000 and the $47,600–$50,000 range, a further 30% decline flagged by at least one institutional analyst as a plausible scenario given the current geopolitical and cycle dynamics. Medium-term, Standard Chartered holds a $150,000 target and CoinShares outlines a path above $170,000 if the Fed is forced into aggressive easing, but those outcomes remain contingent on a macro pivot not yet visible in pricing.
