
主要ポイント
- EUR/USDは、2月から3月にかけての下落相場の50-1-3フィボナッチ・リトレースメントである1.1763を上回って推移しており、これは短期的な強気シナリオにとって構造的に重要な下値支持線となっている。.
- RSI-14は日足チャートで58.79を記録し、移動平均を上回っており、買われすぎ領域に入ることなく上値への勢いが続いていることを確認しています。.
- 欧州中央銀行(ECB)は4月30日の会合で政策金利を据え置いたが、市場は年末までに50ベーシスポイント超の引き締めを織り込んでおり、6月に最初の25ベーシスポイントの利上げが行われる確率を75.1%以上と見込んでいる。.
- 連邦準備制度理事会(FRB)は4月、政策金利を3.501%~3.751%に据え置いた。一方、米国の消費者物価指数(CPI)は3月に前年同月比3.31%に急上昇し、2024年5月以来の高水準となった。これは、中東情勢に起因するエネルギーコストの上昇がほぼ唯一の要因である。.
- 月曜日の5月12日に発表される4月の米国CPI(消費者物価指数)が今週の最大の要因となり、EUR/USDが1.1831を試すか、あるいは1.1680のピボットゾーンへ後退するかを決定づける可能性があります。.
- トランプ氏が7月4日までに欧州連合(EU)の障壁撤廃がなければEU製品に大幅な関税を引き上げると脅したことは、ユーロの持続的な強さに対する地政学的な天井を導入する。.
- パラボリックSARのドットは、現在の価格動向の下に位置しており、3月安値1.1476付近からの回復に続く、強気な構造モードを確認しています。.
市場動向と直近のパフォーマンス
EUR/USDは5月12日の週を1.17798で迎えた。3月の安値圏である1.1476付近から急反発した後、現在は調整局面に入っている。この通貨ペアは過去12ヶ月間で約4.7%上昇し、直近30日間では0.72%の反発を記録しており、地政学的・マクロ経済的な不確実性により抑制されつつも、上昇基調が維持されていることを示している。.
2026年2月初旬に1.2050付近の数年ぶりの高値まで急騰した後、中東情勢の悪化がリスク選好を冷やし、ブレント原油価格を1バレルあたり$100ドル台に押し上げ、安全資産としてのドル買いを誘発したことで、EUR/USDは1.1400付近の安値まで急落したが、その後買い手が再び現れた。 1.1700台を回復して以来、同通貨ペアは1.17~1.18ゾーンへと上昇し、現在、最初の重要な抵抗帯に直面している。.
4月30日の理事会において、ECBは預金ファシリティ金利を2.0%、主要リファイナンス金利を2.15%に据え置いた。これは全会一致での決定であり、タカ派的な色合いを帯びていた。ユーロ圏の4月の速報値インフレ率は、エネルギーコストの高騰を受けて3.0%まで急上昇し、ラガルド総裁は、ECBが「確実に」基本シナリオから逸脱しつつあることを認めた。 ドル相場については、先週発表された非農業部門雇用者数統計とミシガン大学消費者信頼感指数の急激な悪化が重なり、米国債利回りが低下したことで、週末にかけてユーロ/ドルは1.1780付近まで堅調に推移した。.
テクニカル要因とファンダメンタル要因
パラボリックSARは強気なシグナルを発しており、ドットが直近のローソク足本体の下に位置しており、3月以降の回復による短期的な上昇モメンタムを確認しています。RSI-14は終値で58.79を記録しており、可視化された移動平均を上回り、買われすぎが懸念される前に65〜70ゾーンに向かって拡大する余地のある、中立から強気な領域にあります。最近のセッションでは、主要なデータ触媒を控えた保合に一致する、方向性の限定された小さなローソク足が形成されています。.
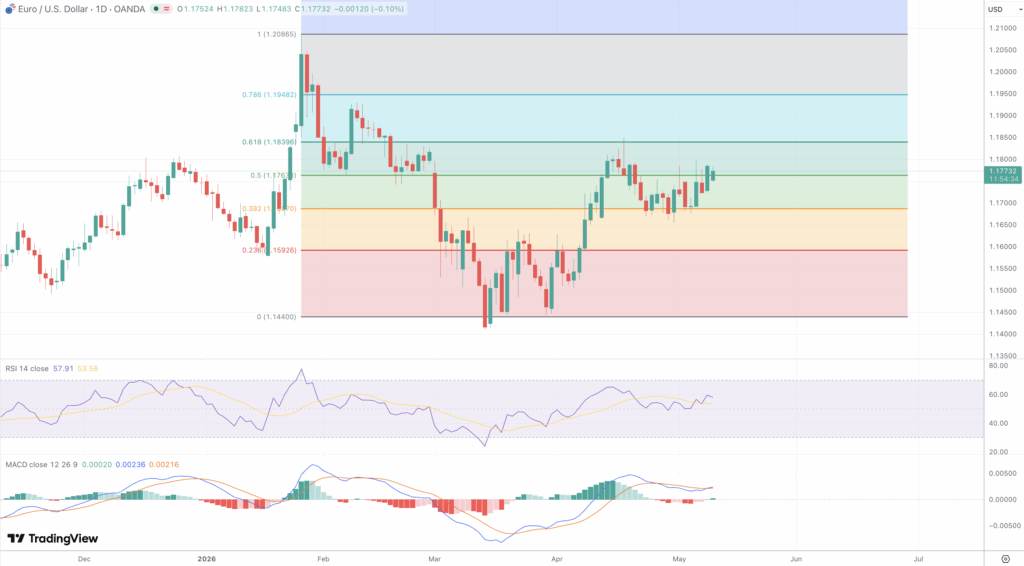
2月の高値(1.2050付近)と3月の安値(1.1476)を用いたフィボナッチ分析によると、現在の価格は1.1763の50.1%フィボナッチ・リトレースメント(TP3T)をわずかに上回っており、これはリトレースメントでの買い手が、下落時の売り圧力を着実に吸収していることを示唆している。 次の上値目標は1.1831の61.8%レベルであり、これは短期的なブレイクアウトの引き金として広く認識されている1.1850のレジスタンスゾーンと一致する。その上には、1.1914の76.4%リトレースメントがあり、その先には重要な1.1974~1.2000のレジスタンス帯が控えている。 下値に関しては、1.1685付近の50日EMAと1.1680の構造的ピボットが最初の防衛ラインを形成している。日足でこれを下回って引けた場合、1.1550が視野に入り、3月の安値である1.1476が最終的な下値の支えとなる。1.17付近を推移する200日SMAは、これらの水準の間に追加的な動的な下値支持線を提供している。 50日SMAが200日SMAを上回っていることは、中期的な強気トレンド構造を裏付けているが、両者の差が縮まっていることは、勢いの鈍化を示唆している。.
主要なファンダメンタルズ要因は、中央銀行の政策の分岐である。FRBは3.50%~3.75%の政策金利を維持している。これは、前年同月比で3.3%を記録した3月のCPI(2022年6月以来の最大の月間上昇率)と、2.6%のコアインフレ率に裏付けられており、短期的な金融緩和の根拠は存在しない。 対照的に、ECBは引き締めへと傾きつつある。市場は年末までに少なくとも2回の25ベーシスポイント利上げを完全に織り込んでおり、6月の利上げ確率は75%を超えている。ECB理事のピエロ・チポローネ氏は、短期的な利上げの可能性が大幅に高まったと公に述べており、金利差が縮小すれば、EUR/USDにとって構造的な追い風となるだろう。 この見通しを複雑にしているのは、ユーロ圏の第1四半期GDPが前期比でわずか0.1%の伸びにとどまったのに対し、米国の年率換算成長率は2.0%であった点だ。また、ECBは2026年のユーロ圏の年間成長率をわずか0.9%、インフレ率を2.6%と予測している。 ブレント原油が1バレルあたり100ドルを上回って推移していることは、ユーロ圏の輸入コストを押し上げ、産業の利益率を圧迫している。一方、トランプ氏が7月4日にEUに対して発した関税に関する最後通告は、地政学的な上値抵抗線となり、事態がエスカレートすれば、ユーロ/米ドルの堅調な足場を急速に蝕む可能性がある。.
今後の見通し
月曜日の朝に発表される米4月消費者物価指数(CPI)が、今週の最大の注目材料となる。3月の前年同月比総合指数が3.31%(3ヶ月移動平均)だったことを踏まえると、4月に鈍化が見られればドル安が加速し、EUR/USDは1.1800を割り込み、1.1831のフィボナッチ目標値が直ちに焦点となるだろう。 特にコアCPIにおいて予想を上回る数値が出れば、FRBによる利上げ休止期間の長期化という見方が強まり、同通貨ペアは1.1680~1.1700のサポートゾーンへと押し戻されるだろう。木曜日のPPIおよび小売売上高データは、インフレと消費動向に関する裏付けとなるシグナルを提供する一方、6月の利上げ準備を示唆するECBのコメントは、1.1850を突破するための二次的な触媒となるだろう。.
持続的な強気相場の継続には、EUR/USDが1.1850を上回る説得力のある日中終値が必要であり、1.1974〜1.2000ゾーンへの上昇につながる可能性がある。パラボリックSARとRSIの指標は、さらなる上昇の試みを支持しており、1.1680を上回る構造は維持されている。しかし、今週のデータフローが決定的な解決をもたらすまでは、1.1680から1.1850のレンジ相場が基本シナリオとなる。.