主要ポイント
- 月曜日のXAU/USDは$4,580で取引されており、前日比0.72%安となっている。FRB内のタカ派的な異論や、米イラン和平交渉の停滞が市場心理を圧迫し、週間ベースでは2週連続の下落となった。
- 日足RSI(14)は40.78で、46.04のシグナルラインを下回っており、モメンタムの低下を確認し、4月の回復からの強気な勢いの枯渇を技術的に裏付けています。
- -11.754のMACD値は、-47.917のシグナルと-36.163のヒストグラムと比較して、中期移動平均構造全体にわたる継続的な弱気圧力を反映しています。
- 米連邦準備制度理事会(FRB)は政策金利を3.75%に据え置いたが、4人の委員が反対票を投じた。一方、CME FedWatchによると、6月の政策金利据え置き確率は94.91%となっており、利回りのない金に対して構造的な制約となる「長期にわたる高金利」環境がさらに強まっている。.
- 3月のPCEは前年同月比で3.51%(3四半期平均)に加速し、コアPCEは3.21%(3四半期平均)に達したほか、第1四半期のGDPは2.01%(3四半期平均)を記録した。これらを総合すると、FRBがハト派的な姿勢に転じる余地はほとんどない。.
- 世界金協会のデータによると、2026年第1四半期の世界の金需要は過去最高の1兆4,193億ドルに達し、中央銀行による純購入量は244トンとなり、需要の底支えとなった。.
- 主要な抵抗線は$4,650~$4,700にあり、$4,800付近には売り圧力が集中しています。主な支持線は$4,510、次いで$4,380と見られます。.
- 今週最も市場を動かす可能性のある材料は、5月5日の4月サービス業PMIとJOLTS(米求人労働異動調査)、5月6日のADP(全米雇用報告)、5月7日の新規失業保険申請件数、そして5月8日の4月非農業部門雇用者数とミシガン大学インフレ期待調査となる。.
市場動向と直近のパフォーマンス
金相場は5月4日の週に入り、再び売り圧力にさらされている。月曜日のXAU/USDは$4,625で取引を開始し、一時$4,629の高値を付けたものの、その後$4,573の安値まで押し下げられ、執筆時点で33ポイントの下落となっている。 この動きは、2026年1月29日に記録した史上最高値$5,595以来続いている下落傾向をさらに強めるものだ。この高値は、2025年11月初旬の約$3,800から約12週間で史上最高値圏まで押し上げた上昇相場の頂点であった。 その後の調整局面は厳しく、4月初旬に$4,150付近で底を打った後、反発の試みにより価格は$4,800付近まで押し上げられた。週足ベースで2週連続の下落を記録した現在、この反発の構造は脆弱であり、月曜日の始値が前日終値を大きく上回ったことは、高値圏での売り圧力を示唆している。.
今年の初めに緊張が高まって以来、ホルムズ海峡が事実上混乱状態に置かれてきた米・イラン間の軍事紛争は、金にとって逆説的な環境を生み出しています。当初、地政学的なリスクプレミアムにより金は史上最高値を更新しましたが、長期にわたる石油供給の混乱は主要経済圏でインフレの継続を煽り、中央銀行は制限的な姿勢を維持せざるを得ず、場合によってはさらなる引き締めを検討することになりました。この安全資産への需要からインフレ主導の金利不安への転換は、金利競争と対峙しながら構造的に見出しとなる資産として、その位置づけを再構築しました。.
米連邦準備制度理事会(FRB)は政策金利を3.751%に据え置いたが、4人の政策委員が反対票を投じた。彼らは、イラン情勢に起因する原油価格の急騰を受け、中央銀行は金融緩和バイアスから完全に距離を置くべきだと主張した。 ジェローム・パウエルFRB議長にとって最後の会合は、政策転換ではなく、委員会の投票結果に明確なタカ派的な傾向が示された形で幕を閉じた。金曜日にイランがホルムズ海峡の再開と核交渉の延期を提案したことで、当初は市場心理が好転し、金価格は$4,600ドル台まで回復したが、その後トランプ大統領が同提案を拒否し、海上封鎖を再確認したことで、週明けにはその上昇分は失われた。.
テクニカル要因とファンダメンタル要因
日足チャートは、複数の指標フレームワークにおいてテクニカルに悪化している状況を示しています。RSI(14)は40.78で46.04のシグナルラインを下回っており、モメンタムは弱気のクロス構成となっており、持続的な反発の前に歴史的に見られるような降伏的な指標が出ないまま、売られすぎの領域に近づいています。4月の安値以降、RSIは50のニュートラルラインを力強く回復しておらず、反発の構造的な弱さを反映しており、5.26ポイントのシグナルラインとの差は、触媒要因による反転が46を決定的に上回るクロスバックを生まない限り、さらなる下落を示唆しています。.
MACDはこの見方を裏付けています。 MACDラインは-11.754、シグナルラインは-47.917、ヒストグラムは-36.163と、いずれも完全にマイナス圏に留まっている。MACDラインは4月の売り圧力による急落時に記録した最も極端な弱気水準から部分的に回復しているものの、強気クロスオーバーが見られないことやヒストグラムが持続的にマイナス圏にあることは、12期間と26期間のEMAの関係が依然として弱気であることを示唆している。 移動平均線の観点から見ると、$4,725付近の21日SMAと$4,751付近の100日SMAはいずれも現物価格を上回って重層的な抵抗線として機能しており、一方で50日SMAは$4,673付近で収束しつつあり、200日SMAは$4,656に接近しているため、上値の抵抗帯がさらに強まっている。 1月29日の高値から引かれた下降トレンドラインがこの抵抗帯を強化しており、2月中旬以降、あらゆる本格的な反発の試みを押し戻してきた。.
1月高値の$5,595から4月のスイング安値付近である$4,150までを引いたフィボナッチ・リトレースメント分析により、短期的な重要な水準が明確になります。 現在の価格($4,580付近)は、23.6%リトレースメント($4,491)と38.2%レベル($4,702)の間に位置しています。 強気派がトレンドの回復を示すには、$4,702を上回って持続的な引けが必要となる一方、$4,873の50%リトレースメントは過去のスイング高値と一致しており、強気の中期的な姿勢への回帰の入り口となる。 $4,491を下回った場合、特に$4,380を割り込んだ場合は、4月の安値である$4,150への再テストに向けた道筋が再び開かれることになる。.
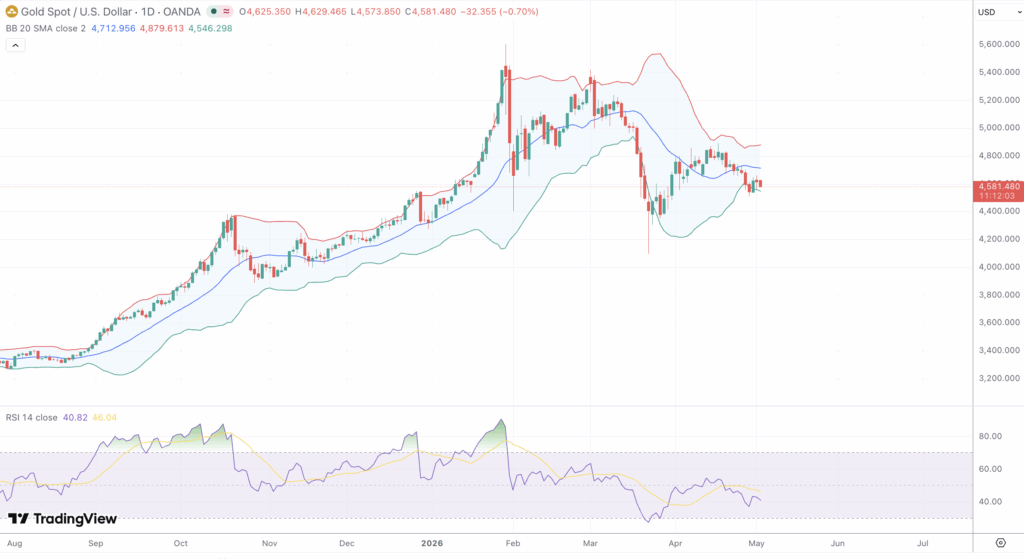
20期間の中間線を下回ってボリンジャーバンドが収縮していることは弱気バイアスを強めている一方、3月と4月のボラティリティのピーク以降、ATRが低下していることから、外部のマクロ的な触媒がない限り、レンジ相場が崩れる可能性は低いと考えられる。高値と終値が相次いで低下していることから、パラボリックSARのドットは価格を上回って推移している。 オンバランスボリュームは価格の回復に追いついておらず、機関投資家の買い集めが上昇相場を維持するにはまだ不十分であることを示唆している。また、直近のローソク足は、$4,620~$4,650のレジスタンス帯において、上ヒゲが長い迷いの強い実体を示しており、これは買いによる吸収ではなく、売りによる放出が進行していることを裏付けている。.
ファンダメンタルズ面では、イラン情勢に起因するインフレの悪循環が依然として最大の懸念材料となっている。3月のPCE(個人消費支出)指数は、前年同月比で2月の2.8%から3.5%へと加速し、前月比では0.7%の上昇となった。コアPCE指数は年率換算で3.2%に達し、FRBの目標である2.%を大幅に上回っている。 第1四半期のGDP速報値が年率換算で2.01%増となったことは、FRBが政策金利を据え置くのに十分な経済の底堅さを示唆している。10年物国債利回りが4.41%を上回っていることは、利回りのない金地金に対して極めて大きな機会費用を生み出している。 世界金協会(WGC)の2026年第1四半期データは、こうした状況に対する構造的な相殺要因を示している。店頭取引(OTC)投資を含む総需要は1,230.9トンに達し、四半期需要額は過去最高の1兆4,919億ドルを記録した。中央銀行による純購入量は244トン、地金およびコインの需要は474トンとなり、これは四半期ベースで過去2番目の高水準であり、前年同期比で421%増加した。 ロイターのアナリスト調査によると、2026年の金価格予測の中央値は1オンスあたり4,916ドルとなっており、短期的な勢いは圧迫されているものの、構造的な強気材料は依然として健在であるという幅広い確信が反映されている。.
今後の見通し
今週は重要な経済指標が相次ぎ、XAU/USDが$4,510~$4,560のサポート帯を上回って安定するか、それとも$4,380に向けて調整局面を再開するかが決まる可能性が高い。5月8日に発表される4月の非農業部門雇用者数(NFP)は、失業率やミシガン大学消費者物価指数(CPI)予想と並んで、最大のリスク要因となる。 堅調な雇用統計と高止まりする消費者インフレ期待は、「高金利が長期化する」という見方を強固なものにし、金相場にさらなる逆風をもたらすだろう。一方、雇用統計が軟調であれば、政策転換の早期化に関する憶測が再燃し、$4,650~$4,702のフィボナッチ抵抗帯を上抜けるテクニカルな回復のきっかけとなる可能性がある。 5月5日の4月サービス業PMIおよびJOLTS、5月6日のADP、5月7日の新規失業保険申請件数は、その前の段階における状況の推移を示すものとなり、5月12日のCPI発表は、その方向性の勢いを翌週へと引き継ぐことになるだろう。.
地政学的には、米イラン情勢が依然として市場に極めて大きな影響を与えている。ホルムズ海峡の再開に向けた進展があれば、原油価格への圧力は緩和され、安全資産へのプレミアムが低下する一方で、政策面での判断はドル安や利上げ期待の後退へとシフトするだろう。進展が見られない限り、原油価格は高止まりし、中央銀行はタカ派的な姿勢を維持し、金価格の上昇余地は限定的となる。 価格が$4,650~$4,700のフィボナッチ・レンジを下回っており、RSIが50を下回っている限り、最も抵抗の少ない方向は依然として慎重な下落方向である。 週足で$4,700を上回って引けた場合、$4,800の抵抗線および$4,873の50%リトレースメントを目標とする、重要なテクニカル転換となるだろう。 $4,510を下回った場合、$4,380、そして最終的には$4,260のピボットゾーンに向けた調整局面が展開されることになる。現時点では、$4,380から$4,800の範囲内での幅広いレンジ相場が優勢であり、モメンタム指標や金利環境は、今後の重要な経済指標発表に向けて、やや弱気な傾向を示している。.