主要ポイント
- Gold trades at $4,674 on the daily chart, posting a loss of $41 (0.88%) as peace talks between the US and Iran remain unresolved and inflation concerns weigh on rate expectations
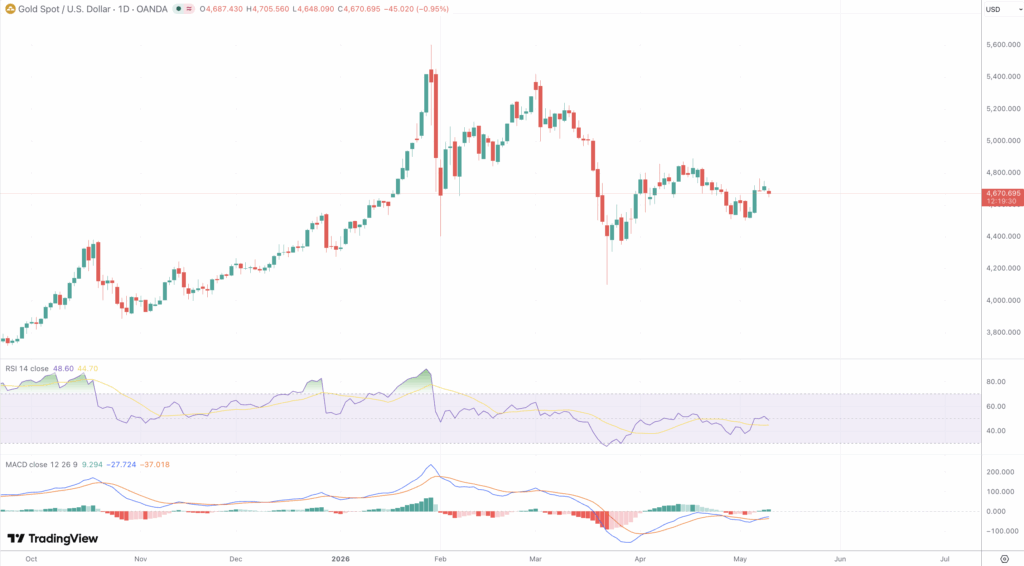
- The RSI-14 reads 48.84 against a signal line of 44.72, placing the pair in neutral territory with the RSI crossing above its average, hinting at a tentative near-term stabilisation
- Price sits just above the 61.8% Fibonacci retracement at approximately $4,635, drawn from the January record high near $5,500 to the March trough near $4,100, making this zone the week’s critical structural support
- The MACD stands at -13.10 on the daily timeframe, still bearish in absolute terms but with histogram momentum dissipating, suggesting downward pressure is losing steam
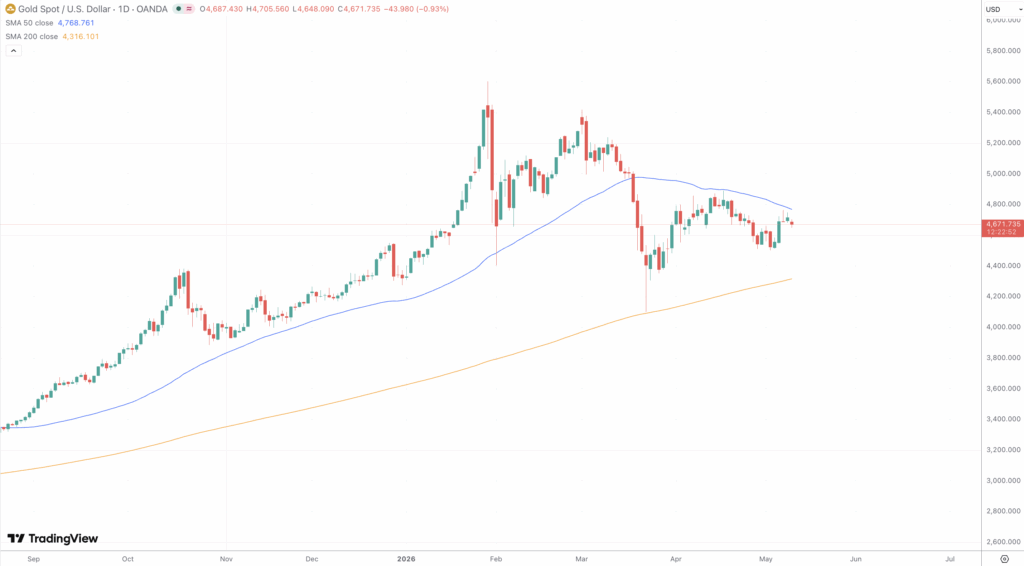
- The 50-day SMA at $4,762 is acting as immediate overhead resistance, with the 5-day SMA at $4,665 now coinciding almost exactly with spot price
- April CPI (May 12), PPI (May 13), and initial jobless claims (May 14) are the headline macro catalysts for the week
- Goldman Sachs maintains a $5,400 year-end target; Morgan Stanley and J.P. Morgan see $5,200 to $5,300 by mid-year; Reuters consensus sits at $4,916 for full-year 2026
- The near-to-medium term trading range of $4,400 to $4,800 is widely cited by institutional desks as the operative band while the Iran conflict remains unresolved
市場動向と直近のパフォーマンス
Gold has spent the better part of 2026 correcting from one of its most exceptional rallies in recorded history. After surging nearly 65% across 2025, driven by aggressive central bank accumulation, a global rate-cutting cycle, and elevated safe-haven demand, the metal peaked near $5,500 in late January before a sequence of powerful macro shocks triggered a sharp reversal. The pivot came on February 28, when US and Israeli forces launched strikes on Iranian military infrastructure, closing the Strait of Hormuz and triggering what the International Energy Agency described as the largest supply disruption in the history of the global oil market.
Rather than propelling gold higher, the Iran conflict destroyed the rate-cut tailwind that had powered the metal through 2025. With Brent crude surging from around $70 to a peak above $126 per barrel, the Federal Reserve’s easing cycle was repriced out of the curve almost entirely. The CME FedWatch tool currently shows a 95.8% probability that rates remain unchanged at 3.50 to 3.75% at the June meeting, and market-implied odds of a rate hike by year-end have now begun to exceed the probability of a cut, a structural shift that has acted as a persistent drag on the non-yielding metal.
From its February high, gold shed approximately $1,400 before bottoming near $4,100 in March. A recovery toward $4,700 followed as ceasefire hopes gathered momentum, with a US memorandum of understanding transmitted through Pakistani mediators briefly lifting the metal above $4,700 and pushing WTI below $90 and Brent under $100. That optimism proved short-lived: Iran subsequently struck vessels in the Strait of Hormuz and set a UAE oil port ablaze, sending gold 2.6% lower on May 4. The pair enters the week at $4,674 with the OECD projecting US inflation at 4.2% for 2026 and Chicago Fed President Austan Goolsbee warning that inflation has not continued cooling toward the 2% target.
テクニカルおよびファンダメンタル要因
Price is consolidating below the 50-day SMA at $4,762 and the 200-day SMA near $4,315, with the 5-day SMA at $4,665 immediately below, compressing the pair into a narrow band that historically precedes a directional move of consequence. The session high at $4,705 aligned closely with the 50-day SMA before the daily candle closed lower, reinforcing that level as overhead supply.
The RSI-14 prints 48.84, with the signal line at 44.72. The purple RSI line has crossed back above its yellow average, a crossover formation that also appeared in late September 2025 and mid-April 2026 ahead of short-term bounces. The green shading between the RSI and its signal has just re-established itself, a near-term directional signal worth monitoring closely. The MACD at -13.10 remains technically bearish but is showing bullish histogram convergence, with negative bars shrinking progressively. A confirmed cross above zero would represent a material shift in the short-term bias.
Fibonacci analysis from the January cycle high near $5,500 to the March swing low near $4,100 places the 23.6% retracement at $5,170, the 38.2% at $4,965, the 50% midpoint at $4,800, the 61.8% golden ratio level at approximately $4,635, and the 78.6% extension at around $4,400. Current price at $4,674 sits just above the 61.8% level, making a sustained daily close above $4,635 essential for the bullish recovery thesis. The Bollinger Band midline near $4,780 to $4,800 represents the base-case technical recovery target, with price currently trading in the lower half of the band structure. ADX shows directional strength moderating from its March peak, with the negative DI still dominant but its lead over the positive DI narrowing, consistent with the MACD deceleration. ATR remains elevated, pointing to wide intraday ranges across the CPI and PPI windows. OBV reflects gradual institutional accumulation during the $4,550 to $4,740 consolidation phase, while the Parabolic SAR plots above price in bearish mode and would require several consecutive bullish sessions to flip. Doji formations at both the $4,557 swing low and the $4,740 recovery high signal indecision at both range extremes, reinforcing that a clean directional resolution awaits a catalyst of sufficient magnitude.
The April CPI print on May 12 is the week’s primary driver. A hot reading would cement expectations for a prolonged Fed hold or hike, strengthening the dollar and pressing Treasury yields higher, both direct headwinds for gold. A softer result could revive the rate-cut narrative and provide the catalyst for a test of $4,800. April payrolls already came in at 115,000 versus expectations of 62,000, reinforcing Fed restraint heading into the data window. Institutionally, Goldman Sachs projects $5,400 by year-end anchored by central bank diversification away from the US dollar, with around 70% of central banks surveyed expecting global gold reserves to rise over the next 12 months. Morgan Stanley holds a $5,200 target contingent on continued US-Iran de-escalation, J.P. Morgan forecasts $5,200 to $5,300 by mid-year, and a Reuters poll of 31 analysts places the full-year 2026 average at $4,916.
今後の見通し
The week presents gold with a clear binary tension. A CPI downside surprise combined with further easing of US-Iran hostilities would support a recovery toward the 50% Fibonacci retracement at $4,800 and the statistical resistance ceiling near $4,828. The opposing scenario, a hot CPI print alongside renewed Middle East escalation, reinforces the bear case toward $4,635 and ultimately $4,400.
The $4,635 level, coinciding with the 61.8% retracement, is the week’s line in the sand. A daily close below it opens $4,557 and then the $4,400 region where the 78.6% retracement and institutional support zones converge. To the upside, a break through the $4,712 to $4,740 band would shift the short-term bias bullish and target $4,800, with $4,876 as the next supply zone above that. A Parabolic SAR flip below price and a MACD crossover above zero are the technical confirmation triggers before conviction buying is justified.
Central bank structural demand, a softer trade-weighted dollar, and entrenched institutional consensus all argue against aggressive bearish positioning. The ceasefire-without-peace-deal stalemate keeps the $4,400 to $4,800 range intact for now, and the macro data slate this week will determine which end is tested first. With the RSI holding above its signal line and the MACD’s bearish histogram fading, the path of least resistance tilts modestly toward stabilisation heading into the data events.