
Key Takeaways
- Bitcoin trading at $108,800, hugging its 50-day SMA near $108,200 while 200-day SMA at $102,500 offers major support.
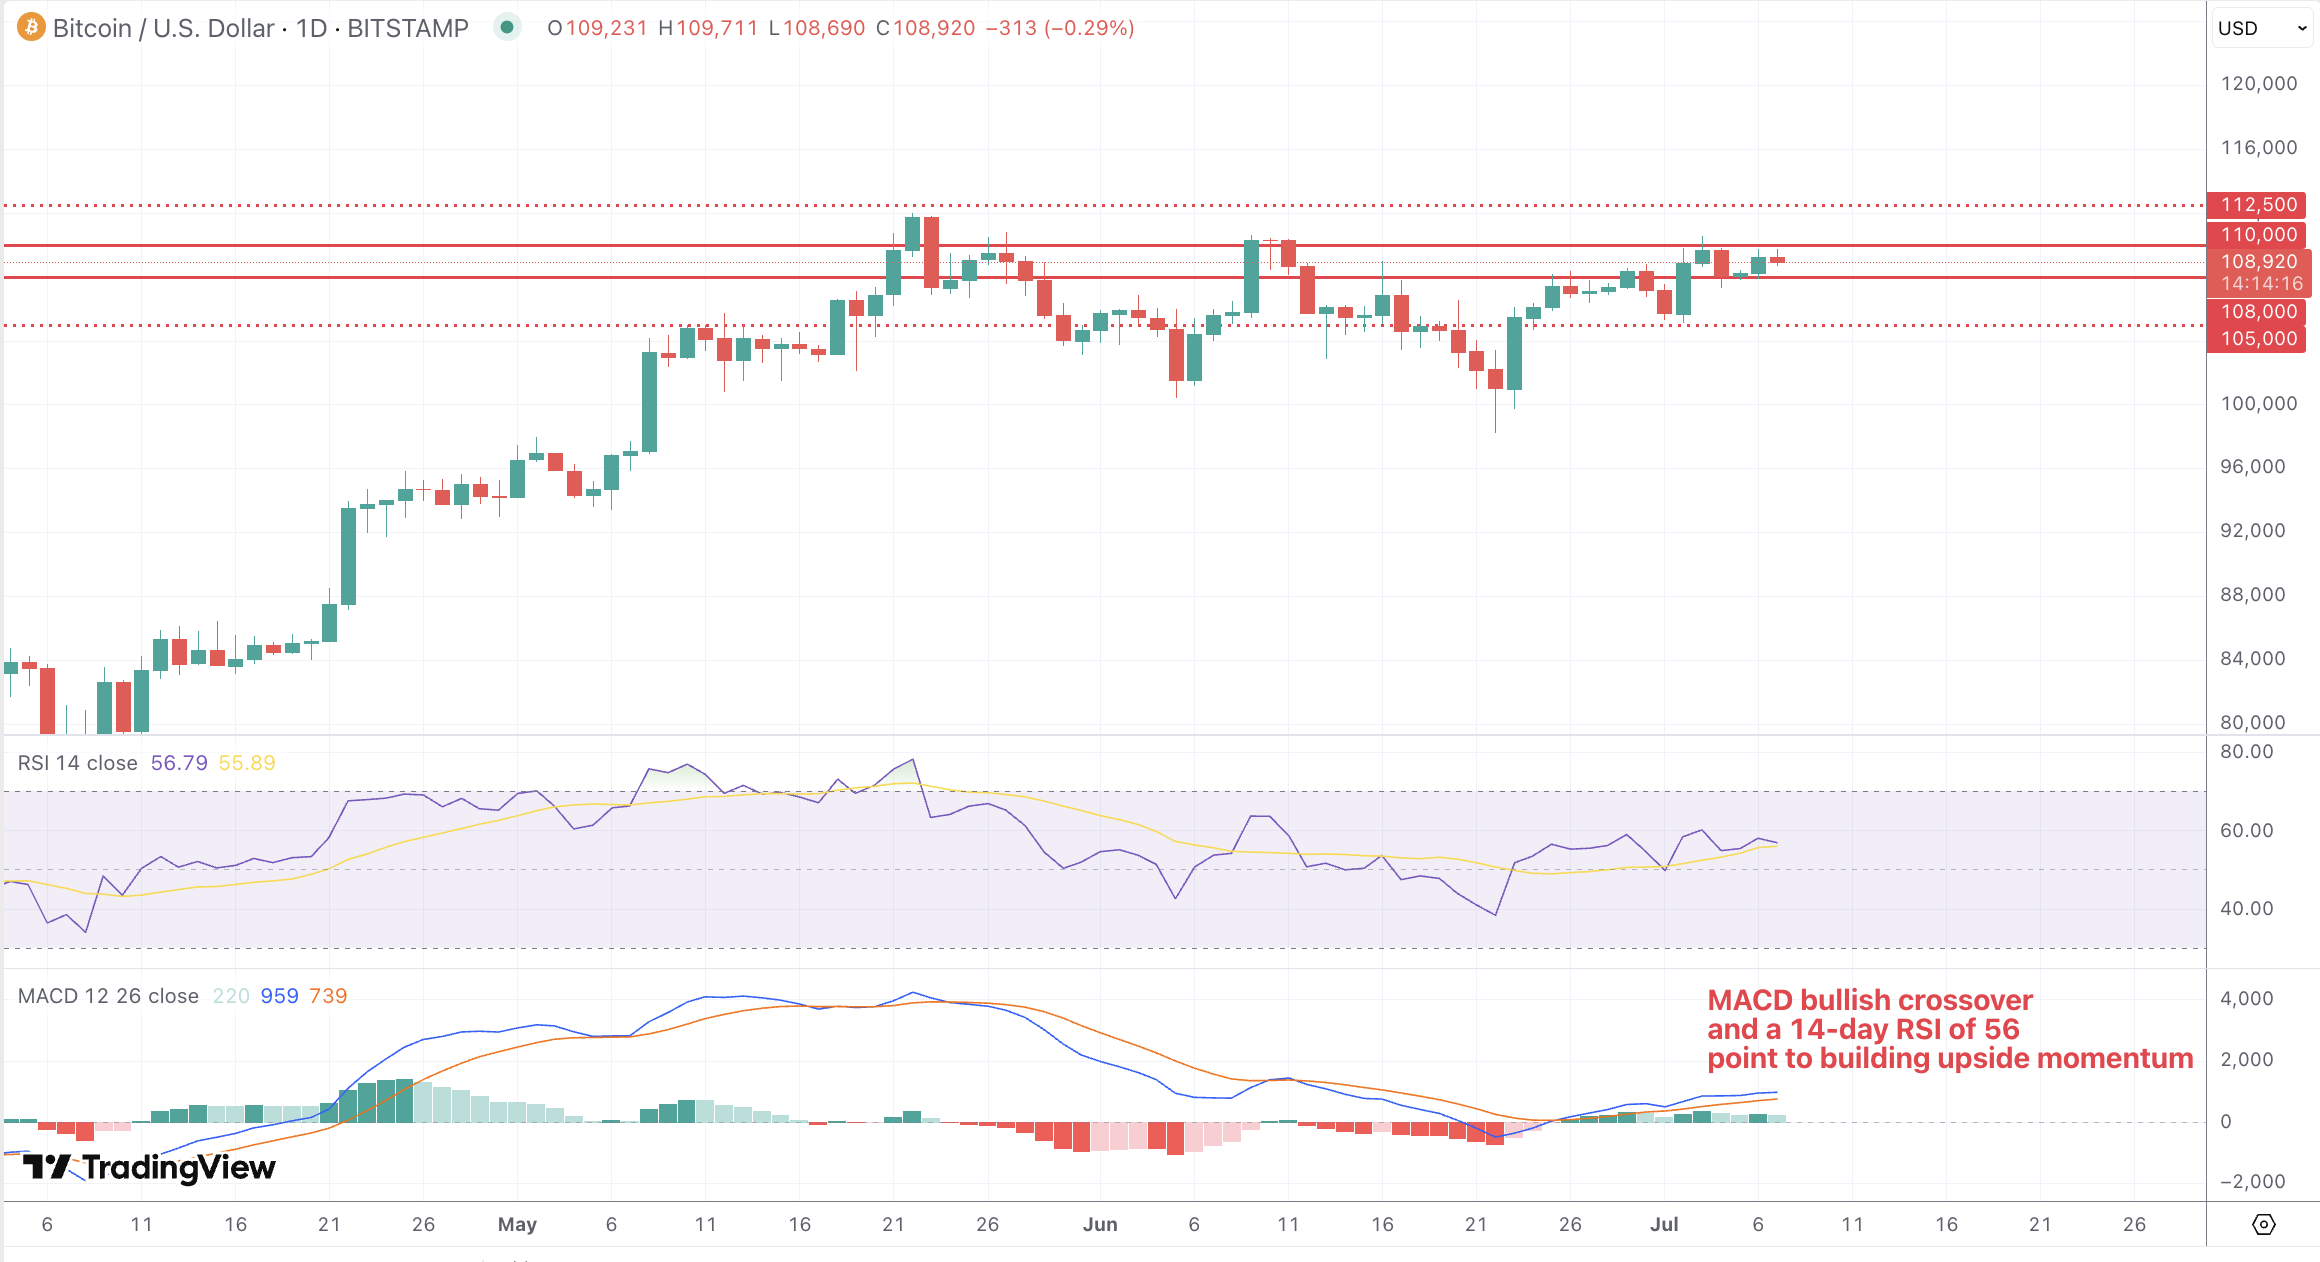
- Immediate resistance at $110,000 and $112,500; support clusters at $108,000 and $105,000.
- Daily MACD bullish crossover and a 14-day RSI of 56 point to building upside momentum.
- On-chain data show a 5% rise in active addresses and solid miner revenues, underscoring healthy network fundamentals.
- Fed minutes, ETF flows, and halving expectations are the primary catalysts for the coming week.
Market Dynamics and Recent Performance
Bitcoin (BTC/USD) has consolidated around the $108,800 mark after testing the $110,000 threshold earlier in the week. A mixture of profit-taking around record highs and renewed institutional interest in spot Bitcoin ETFs has kept volatility elevated. Broader market sentiment remains generally positive, underpinned by expectations that forthcoming U.S. Federal Reserve minutes will reinforce a dovish stance on rate cuts. At the same time, lingering concerns over potential regulatory scrutiny in key jurisdictions have capped gains, leading to choppy intraday swings between $107,800 and $109,600.
Technical and Fundamental Influences
From a technical standpoint, Bitcoin is trading just above its 50-day simple moving average at approximately $108,200, which is now a critical pivot for bulls. The 200-day SMA sits near $102,500, providing a strong secondary floor should downside momentum intensify. On the upside, immediate resistance lies at $110,000, with a more formidable barrier at $112,500, the peak of March’s rally. Short-term oscillators suggest a mild bullish tilt: the 14-day RSI stands around 56, below overbought levels but pointing to upside room, while the MACD line has recently crossed above its signal line on the daily chart, implying building upward momentum.
Volume profiles reveal heavy trading interest around $108,000–$109,000, indicating that a decisive move beyond this node could trigger a swift directional shift. Liquidity clusters also appear near $105,000, where large limit orders may absorb selling pressure.
On-chain metrics reinforce the technical picture: active addresses have ticked up by 5% in the past week, suggesting renewed participation, and miner gross revenue remains robust despite recent difficulty adjustments, highlighting continued network security and confidence among key stakeholders.
Looking Forward
Attention now turns to the upcoming Fed minutes, where any signal of delayed rate cuts could bolster Bitcoin’s appeal as a hedge against monetary debasement and push prices back toward all-time highs around $120,000. Spot ETF flow data will be closely watched—continued inflows could underpin demand, whereas net outflows might trigger short-term selling. Additionally, the lead-up to next year’s halving event is gradually influencing market psychology; as supply issuance trends toward its programmed cut, speculative positioning in futures markets may intensify.
Geopolitical tensions, particularly around major mining regions, remain a wildcard: any disruptions to hash power distribution could briefly unsettle prices. Finally, technical levels at $112,500 on the upside and $105,000 on the downside will serve as crucial decision points for traders, with breaches likely to define the next directional leg.
