
Key Takeaways
- BTC pulled back to the mid-$115k area after last week’s record highs near $124k as Fed-cut optimism cooled, but the broader uptrend remains intact.
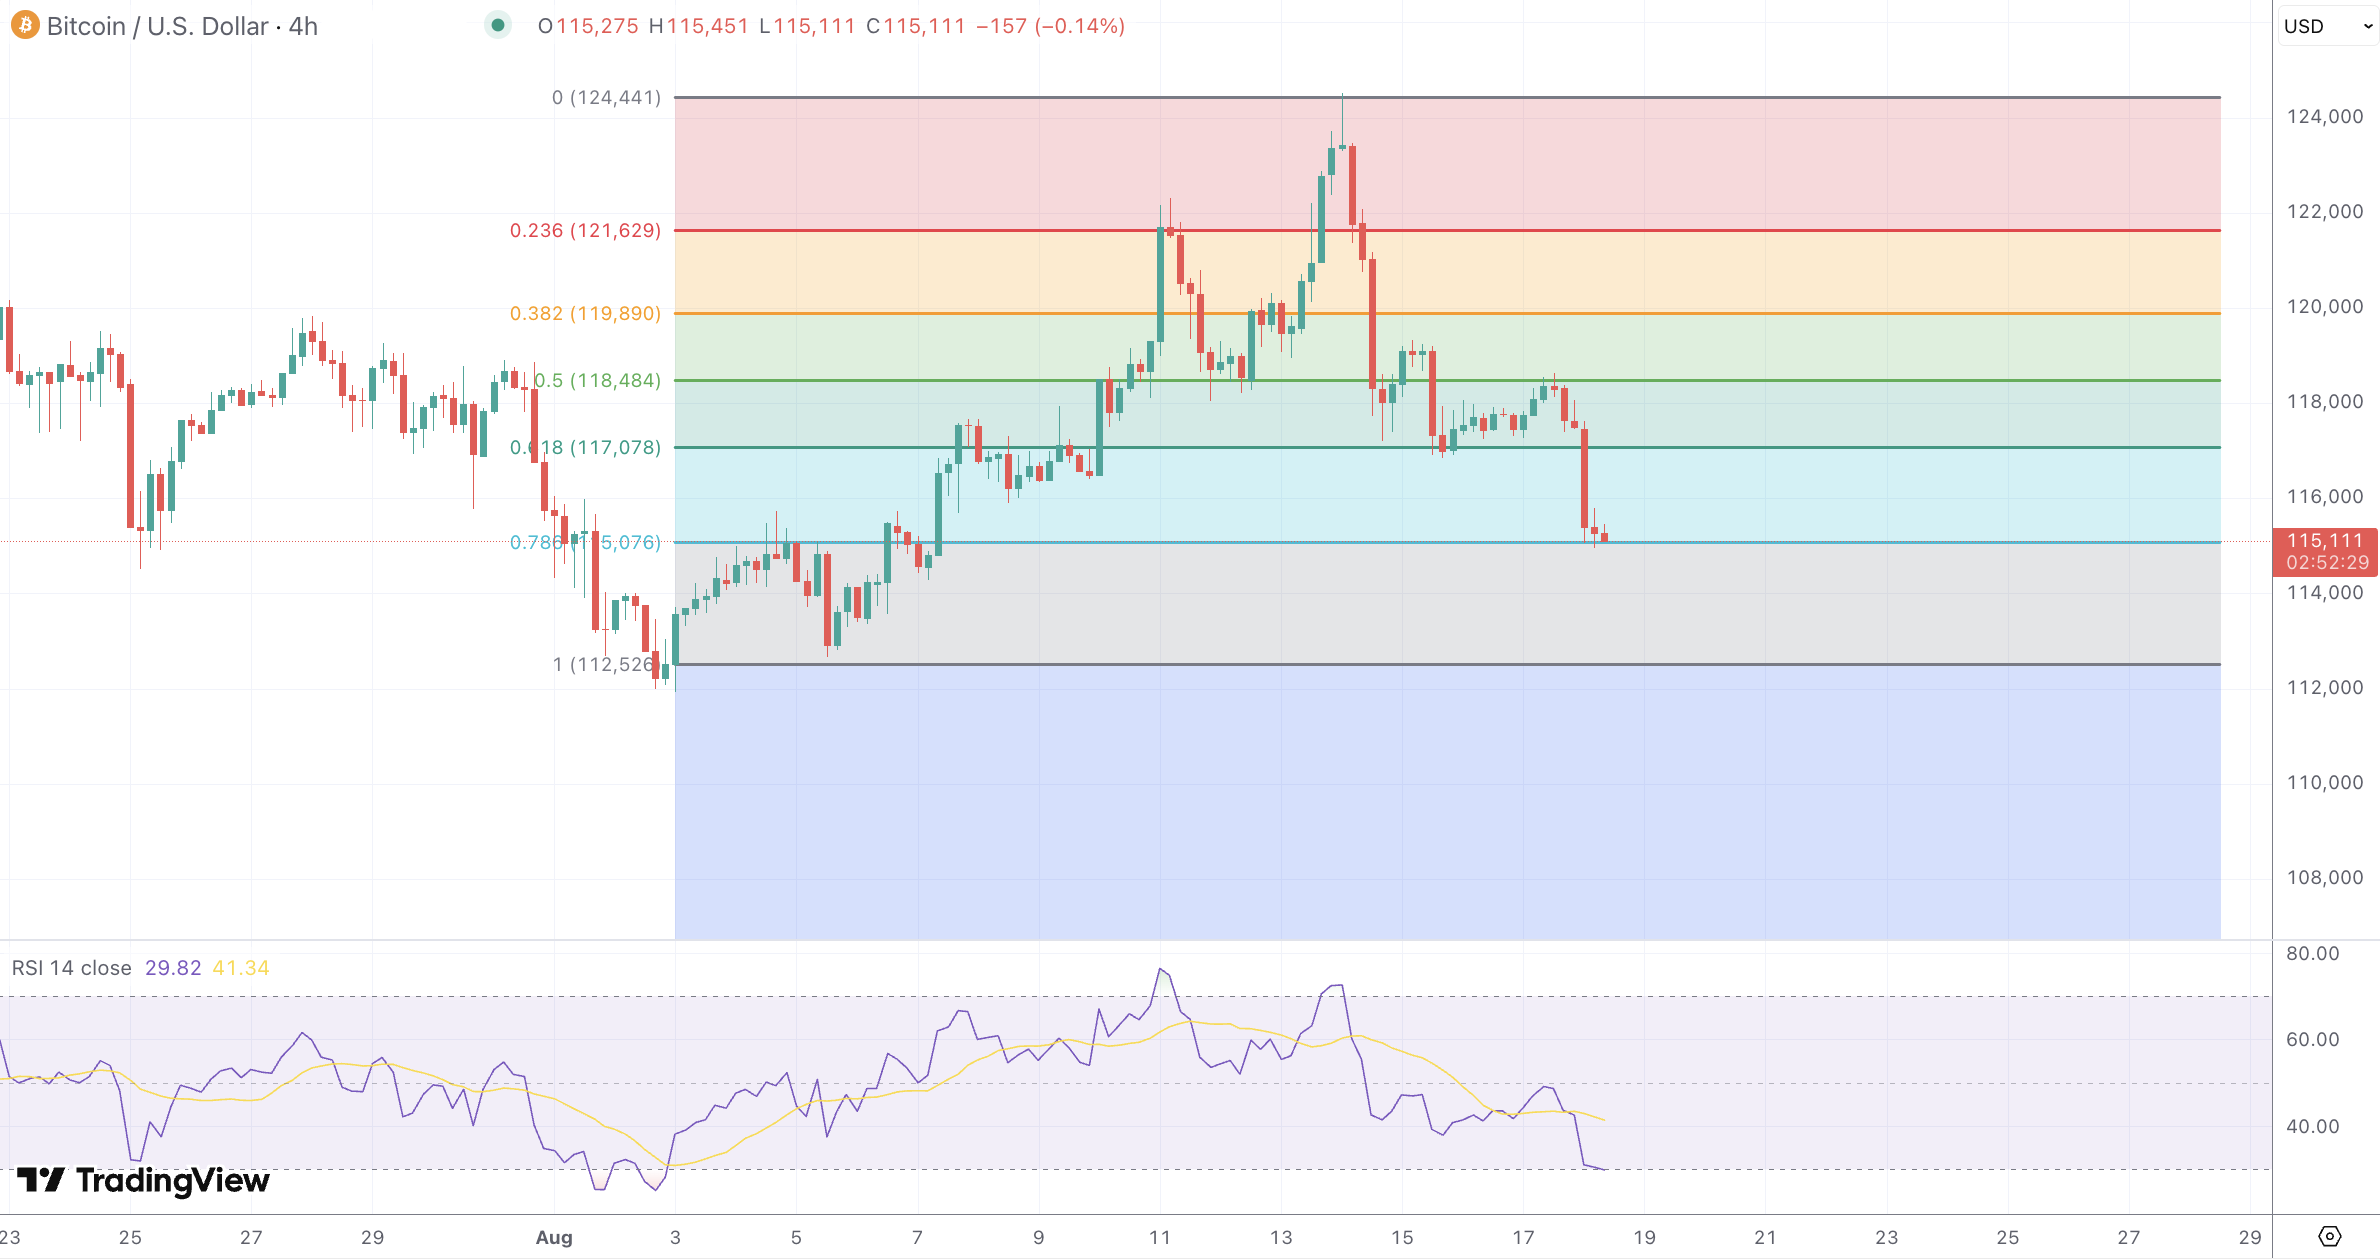
- Fibonacci map from $112,526 to $124,437 sets $115,075 as the 78.6 percent retracement and this week’s pivot, with $117,076, $118,481, $119,887, and $121,626 as layered resistance above.
- The 50-day SMA near $113k and the 200-day near $100k backstop dips, while the 21-week EMA still acts as bull-market support.
- Perpetual funding is flat and options interest is concentrated around $120k to $124k, suggesting balanced risk with potential pinning unless Jackson Hole shifts the macro backdrop.
- Watch ETF flows for confirmation. Strong net inflows would favor reclaiming $118.5k to $121.6k. Sustained outflows would increase the odds of a grind toward $113k to $112k support.
Market Dynamics and Recent Performance
Bitcoin cooled to the mid-$115k area on Monday, August 18, after tagging fresh records near $124k late last week as traders trimmed aggressive Fed cut bets and the dollar steadied ahead of Jackson Hole. The pullback followed hotter wholesale inflation and headlines that dampened immediate policy-easing enthusiasm, though the broader uptrend remains intact year to date.
Flows remain supportive on balance. US spot BTC ETFs saw chunky mid-week inflows on August 14 that offset earlier outflows, while the weekly ledger still shows positive net totals across the complex. Funding on perpetuals is near flat, which implies leverage is not stretched.
Technical and Fundamental Influences
After the all-time high near $124,437 on August 14, price faded into a familiar decision zone. Mapping the August 3 swing low at roughly $112,526 to the August 14 high, the 78.6 percent retracement sits near $115,076, the 61.8 near $117,078, the 50 percent at $118,484, the 38.2 near $119,890, and the 23.6 around $121,629. Spot hovering just above the $115k band means bulls need to defend this pocket to avoid a deeper check into $113k to $112k. A daily close back over $118.5k would put $119.9k then $121.6k and the record highs back in play.
Trend filters still lean constructive. The 50-day SMA is advancing near the low-$113k zone and the 200-day average is now around six figures, reinforcing layered support on dips. On the weekly timeframe, the 21-week EMA continues to act as bull-market support.
Derivatives positioning looks balanced to slightly cautious. Perpetual funding prints around 0.00 to 0.01 percent, not the kind of froth that typically precedes sharp washouts. Recent options expiries showed a put-call ratio near 0.90 and heavy open interest around the $120k to $124k strikes, a mix that can pin price inside this band unless a catalyst forces a break. Separately, IBIT ETF options saw notable bullish positioning into late-August expiries, hinting at persistent dip-buying appetite on the listed side.
Macro drivers are the known swing factors. The dollar’s path and Chair Powell’s remarks at Jackson Hole on August 21 to 23 will steer risk appetite. A reaffirmed September cut without hawkish pushback would likely keep BTC supported above $113k to $115k. A firmer dollar and yields would risk a retest of $112k, then $110k, where prior breakout demand sat earlier in August.
Looking Forward
The playbook for this week is straightforward. Respect $115k as the near-term pivot. Hold above it and intraday momentum can rotate back toward $117.1k, $118.5k, then $119.9k to $121.6k where sellers repeatedly engaged. Lose $115k on a daily close and probability increases for a probe into $113k to $112.5k, with $110k to $108k as a secondary cushion if macro winds turn risk-off. ETF flow tone and funding should confirm the move: renewed inflows plus steady funding would favor topside rotation, while net outflows and rising negative funding would argue for more consolidation first.
