
Key Takeaways
- BTCUSD starts the week around 114,000 to 116,000 after a 4 percent weekly gain, with last week’s range roughly 110,800 to 116,700.
- Weekly pivot sits near 114,525, with R1 around 118,270 and R2 near 120,430. S1 is close to 112,370 and S2 near 108,620.
- Fibonacci supports from the 108,253 to 116,723 leg cluster near 113,490, 112,490, and 111,490, adding confluence beneath the pivot.
- 200 day moving average is in the low 102,000s, the 50 day sits in the mid 114,000s, and daily RSI is neutral in the high 40s.
- ETF flows were net positive early September, funding and basis are firm but contained, which argues for a grind higher unless the Fed surprises.
- A 25 bp Fed cut with open ended guidance favors a push toward 118,270 and possibly 120,430. A cautious tone would likely keep price boxed around the pivot and last week’s high.
Market Dynamics and Recent Performance
BTCUSD opens the week in the mid 115,000s after a steady two week climb from early September’s dip near 108,000. The pair added roughly 4 percent over the last five sessions, aided by a softer dollar tone and rising odds of a quarter point Fed cut at the September 16 to 17 meeting. Spot action has been tight but constructive, with last week’s range capped by a 116,700 area high and anchored by a 110,800 area low, and Friday’s close holding just above 116,000. The bigger picture context still includes July’s break to fresh records above 120,000, which keeps sentiment skewed positive into the Fed.
Flows and positioning are supportive rather than euphoric. Early September brought chunky creations in the U.S. spot Bitcoin ETFs, followed by a couple of outflow days that kept the net picture mildly positive, while perpetual futures funding has hovered near the low double digits annualized and CME futures basis remains below 10 percent. Together that reads like healthy risk appetite without leverage getting out of hand.
Macro still matters. August U.S. CPI rose 0.4 percent month on month and 2.9 percent year on year, yet markets continue to lean toward a single 25 bp cut this week, putting the dollar and front end yields at center stage for crypto direction.
Technical and Fundamental Influences
The near term price map is clean. Using last week’s high at 116,684, low at 110,781, and close near 116,111, the weekly pivot comes in around 114,525. First resistance stands near 118,270 and second resistance near 120,430. First support sits around 112,370 and second support near 108,620. Spot has been oscillating on the bullish side of that pivot since Thursday’s CPI print.
Fibonacci cushions back the idea that dips may be shallow. Measuring the early month upswing from roughly 108,253 to 116,723, retracement supports cluster near 113,490, 112,490, and 111,490. That stack lines up closely with S1 and the upper end of last week’s value area, which should attract dip buyers unless the macro tone sours.
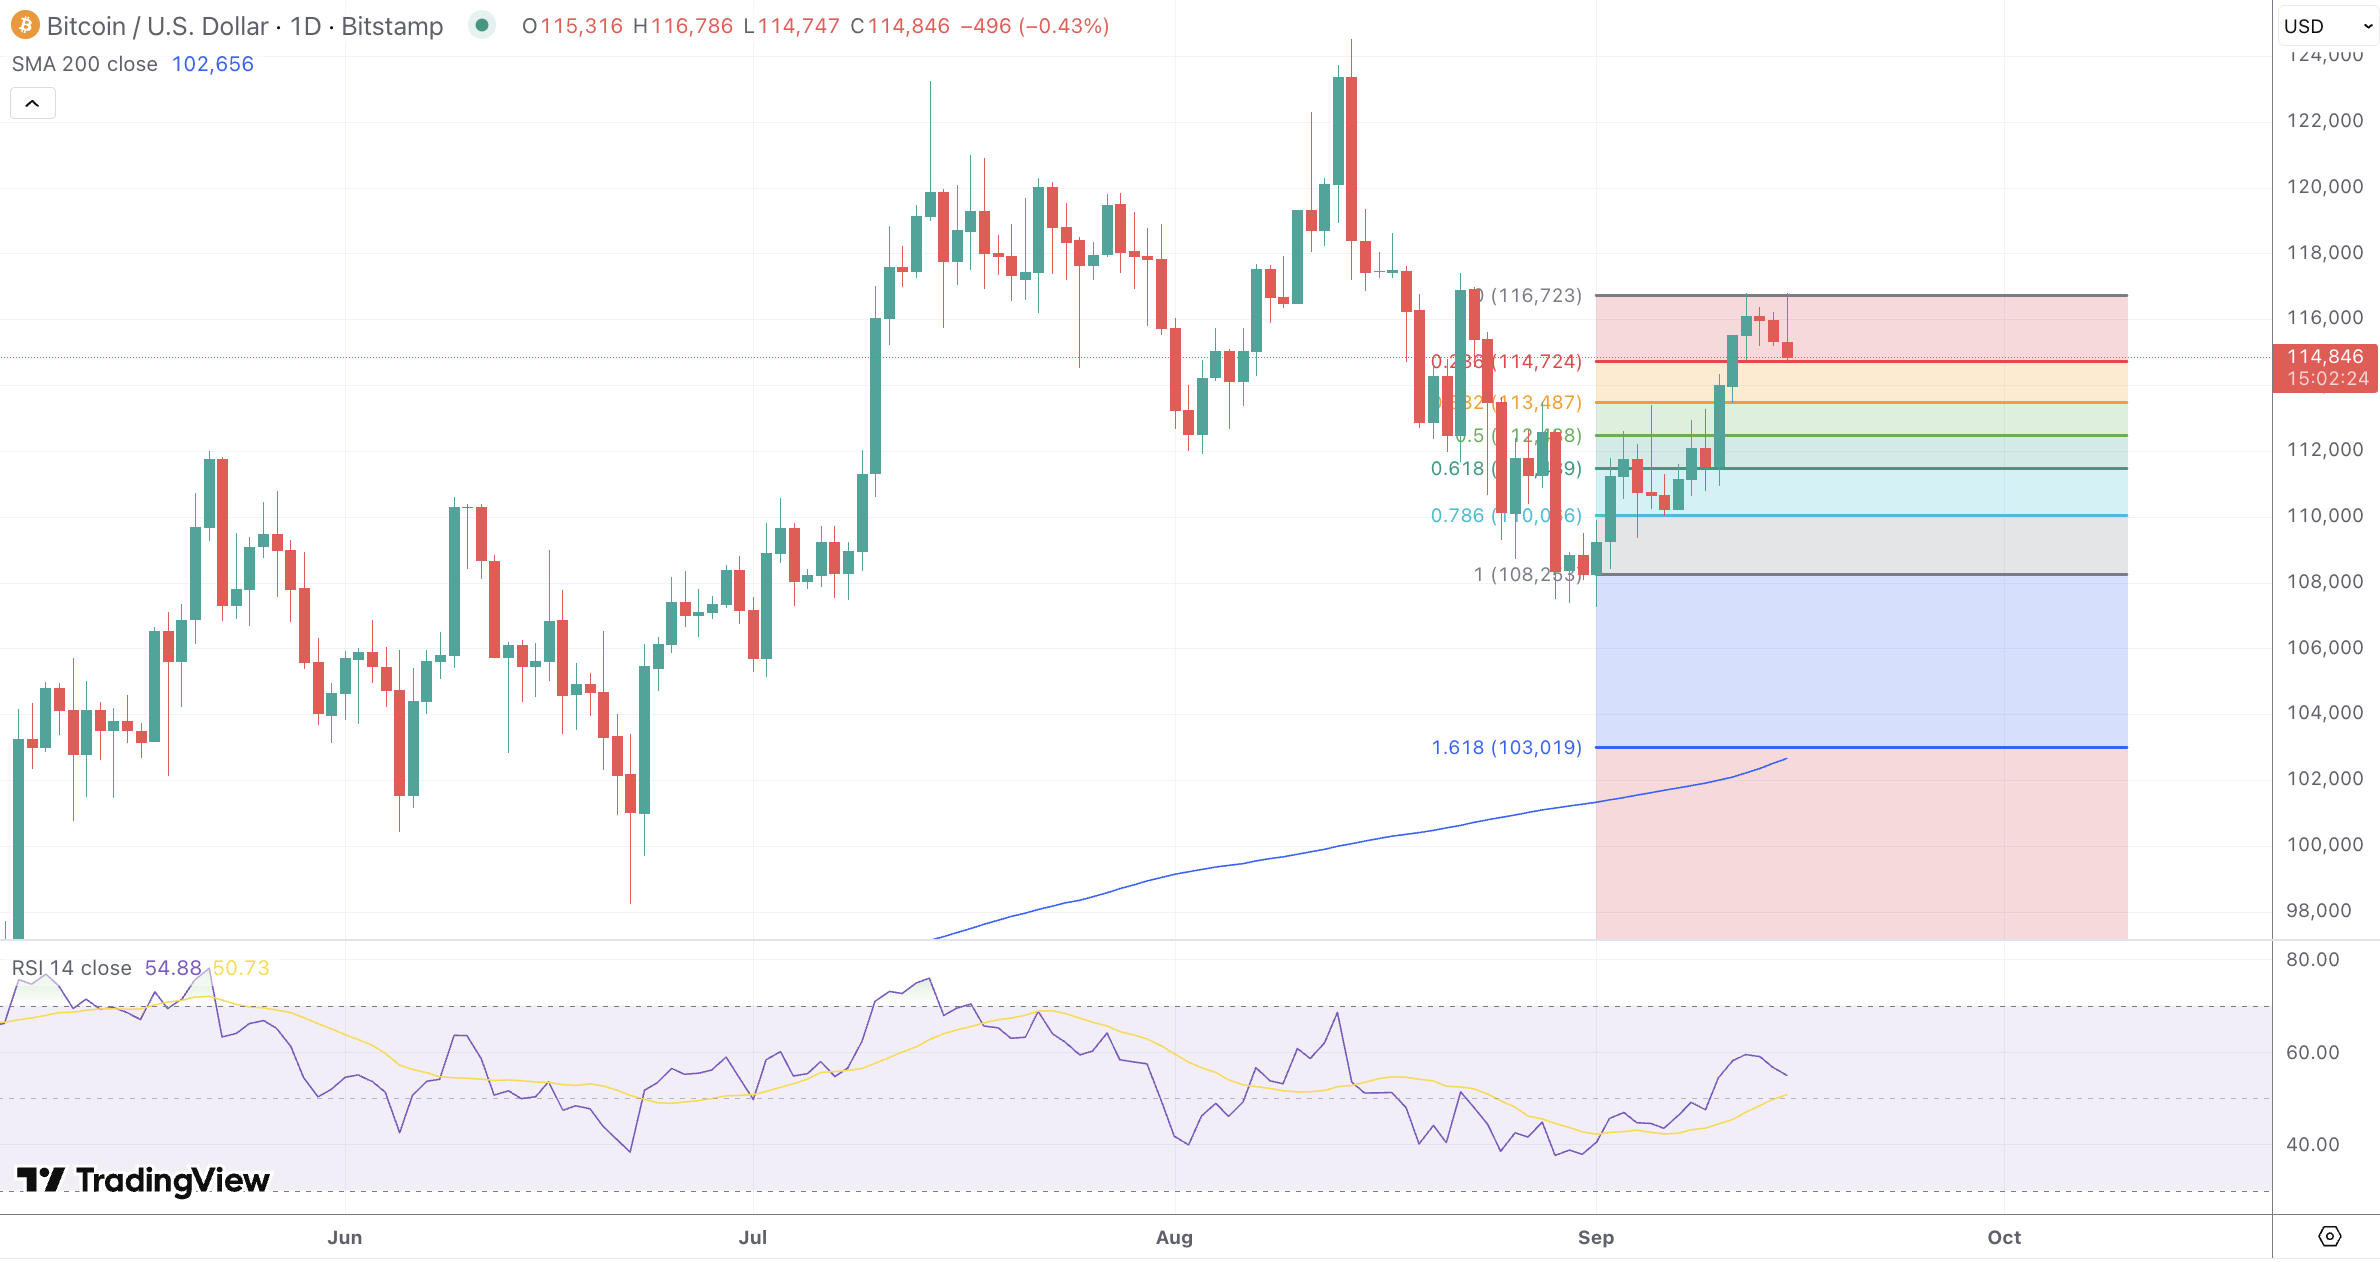
Trend gauges remain favorable. The 200 day moving average has climbed into the low 102,000s, and several venues have the 50 day moving average tracking in the mid 114,000s. Daily RSI sits in neutral territory in the mid 50s, which usually allows trend continuation if price holds above the weekly pivot. On chain, short term holder cost basis has pushed to a record, a hallmark of late trending phases when pullbacks are met with demand near rising averages.
Derivatives and basis are aligned with a grind higher rather than a melt up. Funding remains positive but contained and CME open interest has cooled from peak levels this year, while the annualized basis has stayed under 10 percent. That mix often limits forced moves, keeping the market sensitive to macro headlines and ETF flow bursts for direction.
Looking Forward
Base case for this week is a choppy bullish bias while the market keys off the Fed. A 25 bp cut paired with guidance that leaves the door open to additional easing into year end would likely push BTCUSD through 118,270, which would expose the 120,430 region and, above there, the July record area. A more guarded message that stresses data dependence and resists hinting at follow on cuts would probably cap rallies near last week’s high and nudge price back toward 114,525, with 113,490 to 112,490 as the first zone where dip demand should appear. If risk assets wobble and BTC loses the pivot on a daily close, 112,370 and then 108,620 become the key downside checkpoints.
Keep an eye on ETF prints around the decision, funding behavior, and whether RSI can firm back above 50 while spot holds the 50 day average. If those conditions line up, the path of least resistance stays higher. If flows flip negative and basis compresses into the mid single digits with price below the pivot, expect more two way trade inside last week’s range until a fresh catalyst arrives.
