
Key Takeaways
- BTC begins the week near 112,000 after a stop-run below 110,000 and a fast rebound.
- ETF complex saw a big weekly net outflow, though IBIT still posted inflows, making flows the key catalyst for direction this week.
- Resistance: 113,500 then 115,800, with extensions to 118,800 and 120,500 if momentum builds.
- Support: 110,000 to 109,200 first, then 107,500 and 105,000, with 101,500 to 100,000 as deeper downside magnets.
- Daily structure improved close the 20-day EMA, MACD close to a bullish cross, RSI mid-band allowing two-way trade.
- Mining difficulty at record highs keeps network fundamentals strong, but short-term price path hinges on flows and macro headlines.
Market Dynamics and Recent Performance
Bitcoin starts the week hovering around 112,000 after whipping below 110,000 late last week, then rebounding into the weekend. The swing arrived alongside the sharpest weekly net outflow from U.S. spot BTC ETFs in months, even as BlackRock’s IBIT still attracted fresh money. Options desks flagged heavier downside hedging into the dip while macro chatter about a potential U.S. government shutdown clipped the dollar and steadied risk sentiment. On-chain, mining difficulty sits at an all-time high, a sign of persistent network security and capex commitment despite short-term price chop.
Technical and Fundamental Influences
Price action keeps a constructive medium-term bias, but the near-term tape is two-way. On the daily chart, BTC is riding above the 100-day EMA and almost reclaimed the 20-day EMA on the bounce. Momentum gauges recovered from neutral to modestly positive, though the 14-day RSI sits mid-band, leaving room in both directions.
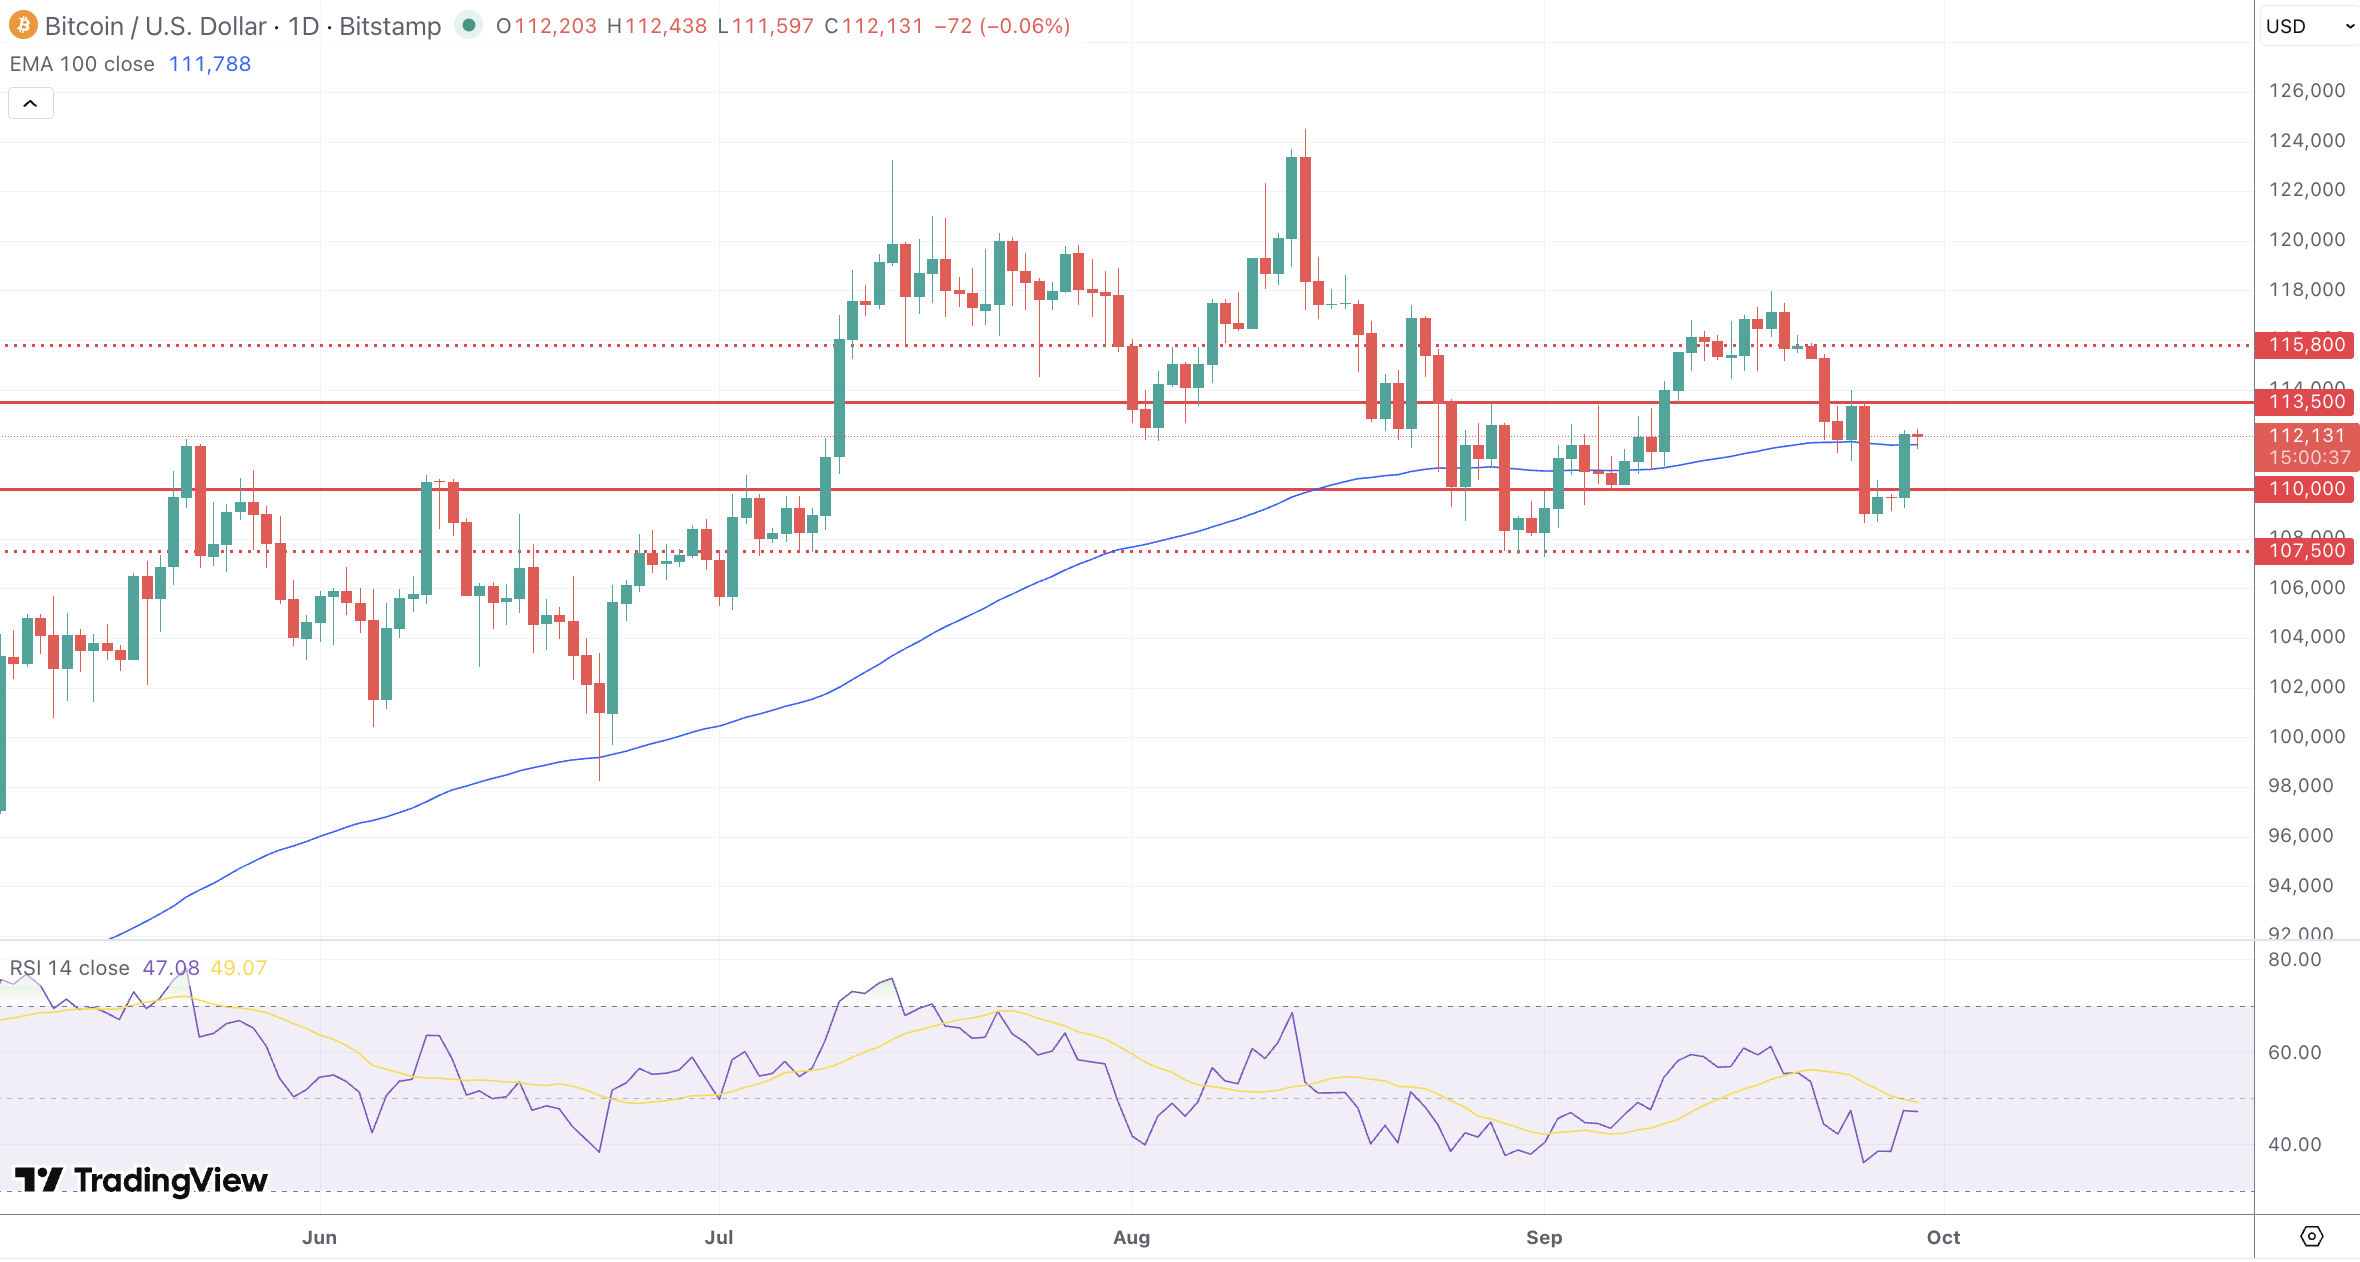
Resistance layers are stacked at 113,500 then 115,800. A daily close through 115,800 would set sights on 118,800 and the 120,500 area from August’s highs. Above that, 123,500 to 124,500 is a major supply zone. First support is 110,000 to 109,200 where last week’s shakeout stalled. Lose that shelf and 107,500 comes into view, then 105,000. A deeper flush would target 101,500 to 100,000, a psychological magnet and prior breakout base.
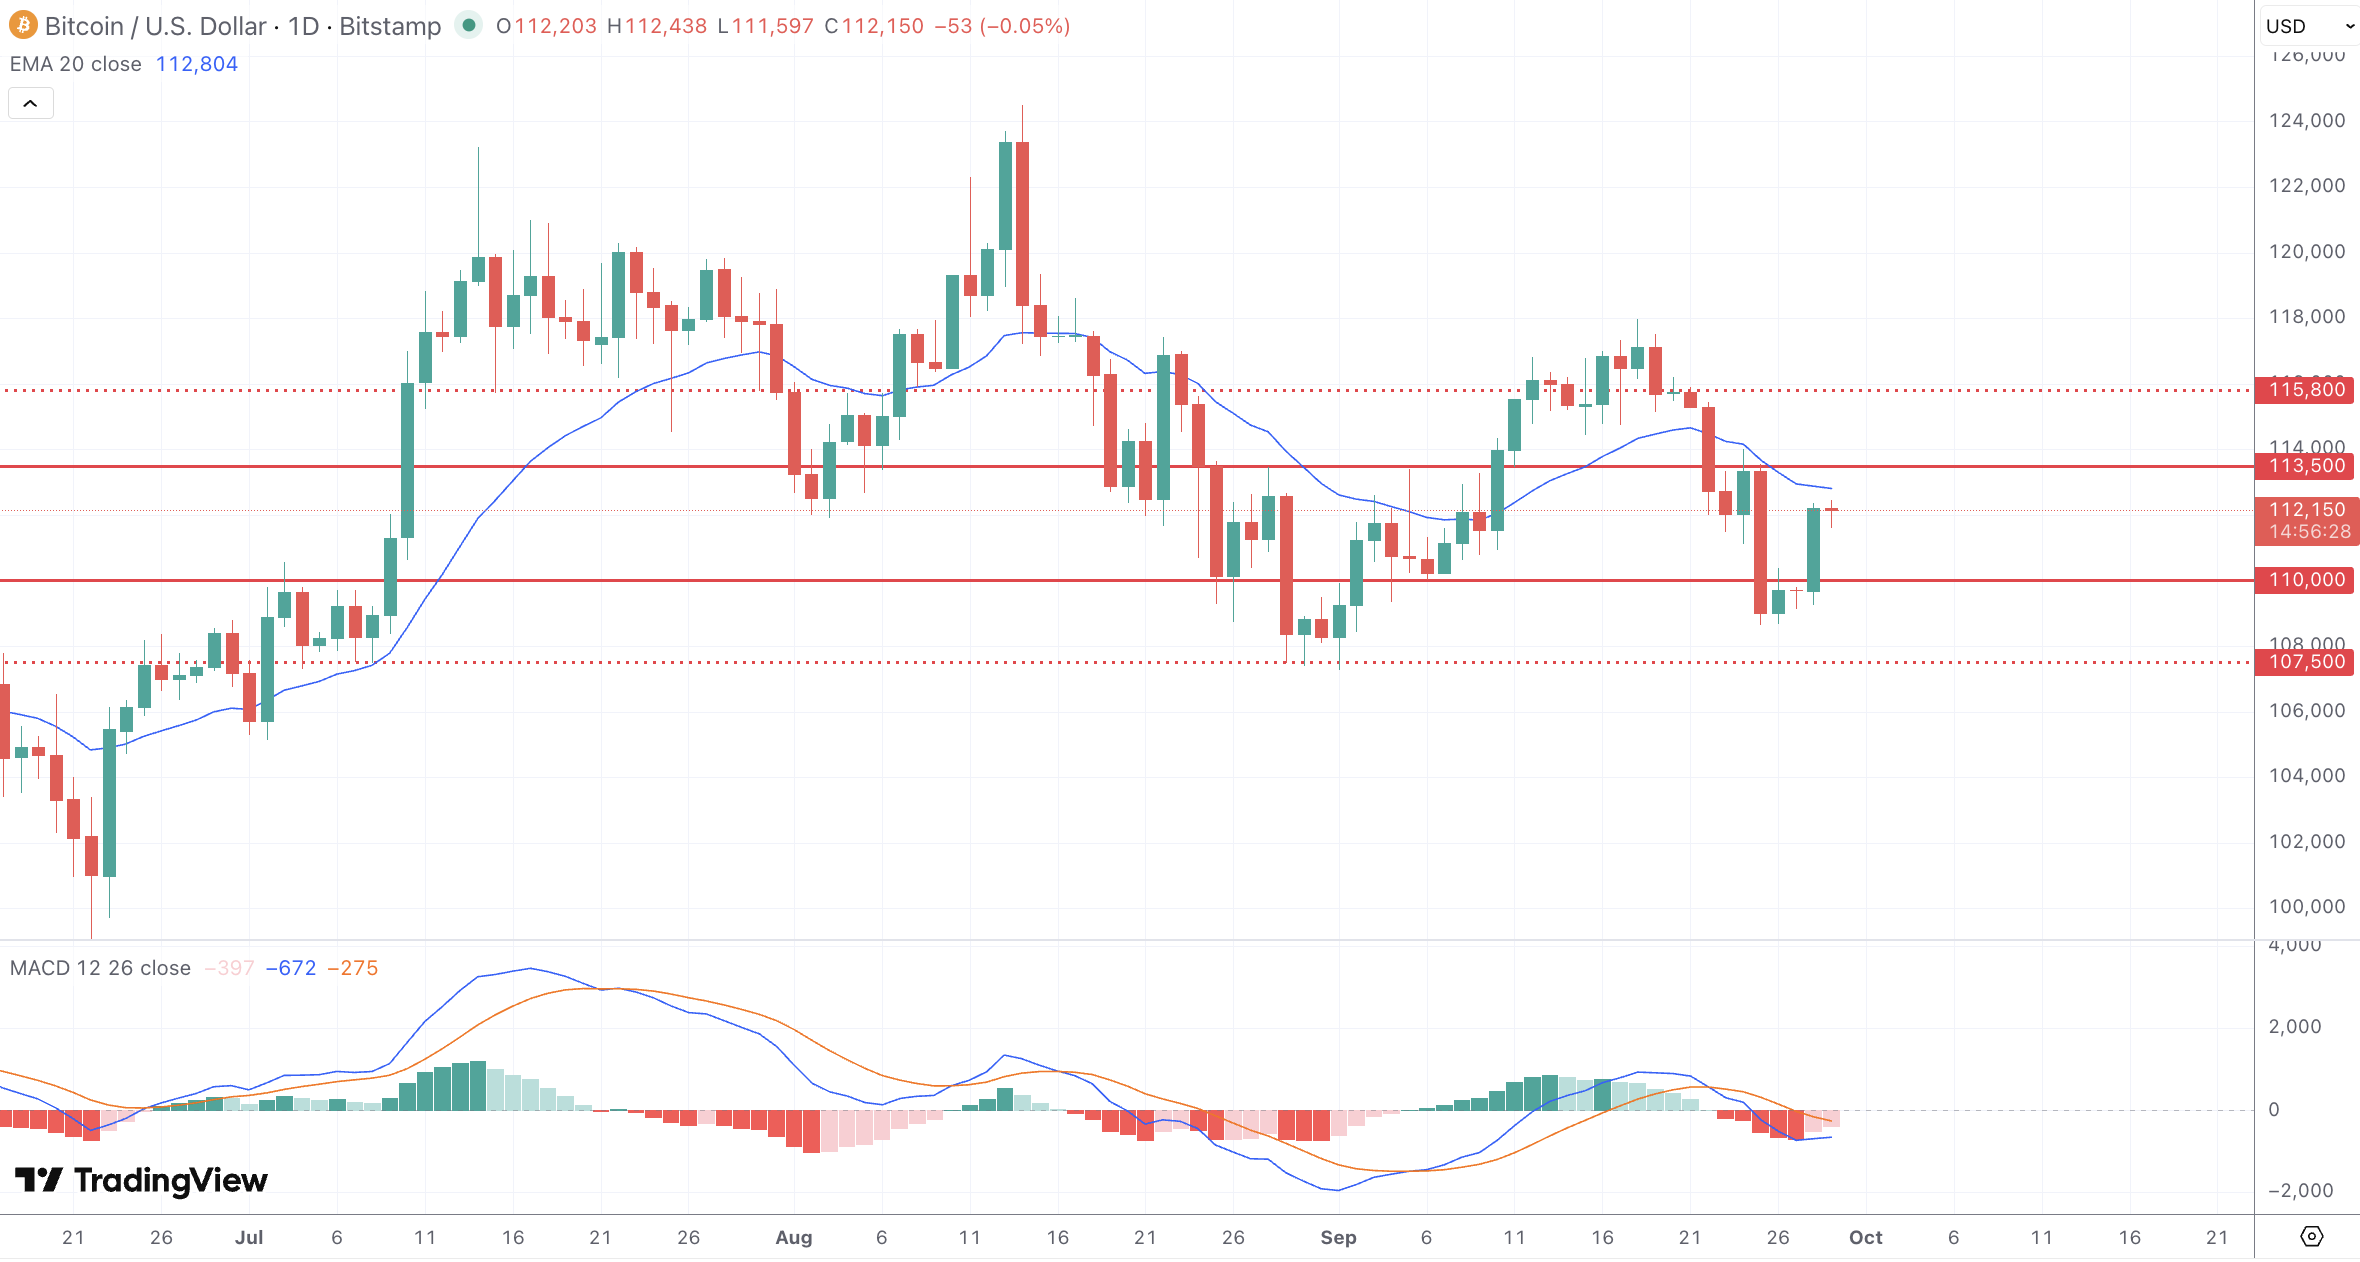
The rebound broke a minor bearish trendline and pulled price almost over the 20-day EMA, which often precedes re-tests of the next resistance band. Daily MACD is close to a bullish cross, yet not confirmed. On a 4-hour view, market profile shows a high-volume node around 111,200 to 111,800 that should act as an intraday pivot. A sustained hold above this pocket favors continuation toward 113,500. Failure there and a slip back under 110,000 tilts the bias to range re-tests at 107,500.
Spot ETF flows matter this week. The market just absorbed a sizable weekly net outflow across the complex even as IBIT posted net inflows, underscoring rotation rather than a wholesale exit. If outflows persist, rallies could stall into resistance. Conversely, a quick return to net inflows would reinforce dip-buying. Mining difficulty and hashrate near record territory continue to signal strong network fundamentals, which historically align with bull-cycle underpinnings when liquidity cooperates. Headlines around federal funding and any data delays could jolt risk appetite and the dollar, adding short-term volatility to BTC.
Looking Forward
Tactically, bulls want acceptance above 113,500 to press 115,800 then 118,800. Into those zones, consider scaling profits and tightening stops because ETF flow headlines can flip intraday tone quickly. If price fades under 111,200, a probe of 110,000 to 109,200 is likely. That area is the week’s first tactical buy zone for mean-reversion setups with invalidation under 109,000 and targets back to 112,500 to 113,500. Momentum longs should wait for a daily close above 115,800 to avoid chop. Bears need a firm close below 109,000 to open 107,500 and possibly 105,000.
Risk management remains paramount. Keep sizing modest around data and policy headlines, respect liquidity pockets, and avoid chasing breakouts without confirmation from both volume and ETF flow stabilization.
