Key Takeaways
- XAU/USD trades at $4,716 at the weekly open, sitting on the 50.0% Fibonacci retracement of the March decline at a classically contested equilibrium zone.
- The 4-hour RSI(14) reads 50 against a signal of 54, indicating a neutral-to-soft near-term bias; the daily MACD is slightly negative at -12.36, confirming fading momentum without reversing the broader recovery structure.
- Key resistance stands at the 61.8% Fibonacci level near $4,840 and the 4-hour 200-period SMA at $4,883; a sustained close above this cluster targets $4,908 then $5,131.
- Immediate support is layered at $4,700, $4,650, and $4,595; a break below $4,595 would significantly damage the short-term bullish case.
- US CPI at 3.3% year-on-year has reset rate-cut expectations to near zero; March PPI due April 14 and the Fed Beige Book on April 15 are the key data events this week.
- Geopolitical risk remains the dominant swing factor; any escalation in Lebanon or diplomatic collapse would likely drive gold toward $4,850-$4,900.
- The longer-term bull case is supported by multi-region central bank accumulation, China’s reserves at an all-time high of 2,309 tonnes, and JPMorgan and Goldman Sachs maintaining a $4,000-$6,300 range for 2026.
Market Dynamics and Recent Performance
Gold opens the week of April 14 trading at $4,716, consolidating near the upper end of a recovery that began from the mid-March lows around $4,250. The 4-hour chart shows a sequence of higher lows since the March trough, with the most recent swing high at $4,855 before a pullback to the $4,716 weekly open.
Gold fell more than 11% from its early-March peak above $5,500 as Middle East hostilities on February 28 paradoxically hammered the metal, with soaring oil prices suppressing rate-cut expectations and driving the dollar to prominence as the primary safe-haven vehicle. A two-week US-Iran ceasefire in early April reversed much of that dynamic, triggering a sharp drop in crude and redirecting flows back into gold, producing three consecutive weekly gains. XAU/USD advanced approximately 2% in the week ending April 10, settling near $4,780. The 52-week range of $3,120 to $5,595 underscores the extraordinary volatility that has defined 2026.
Central bank appetite, while slowing at the headline level to roughly 5 tonnes globally in January against a 2025 monthly average of 27 tonnes, has broadened geographically. Malaysia, South Korea, and Uzbekistan re-entered the accumulation cycle, and China’s official reserves reached an all-time high of approximately 2,309 tonnes.
Technical and Fundamental Influences
At $4,716, price sits on the 50.0% Fibonacci retracement of the full March decline from the $5,211 structural high to the $4,243 swing low. This level has acted as a pivot on multiple intraday tests over the past week. Resistance above sits at the 61.8% retracement near $4,840, which closely coincides with the 200-period SMA on the 4-hour chart at approximately $4,883. A sustained close above this confluence targets $4,908, $5,131, and ultimately $5,211. To the downside, the 38.2% retracement near $4,613 is the first meaningful floor, followed by $4,595 and the more substantial support cluster at $4,401.
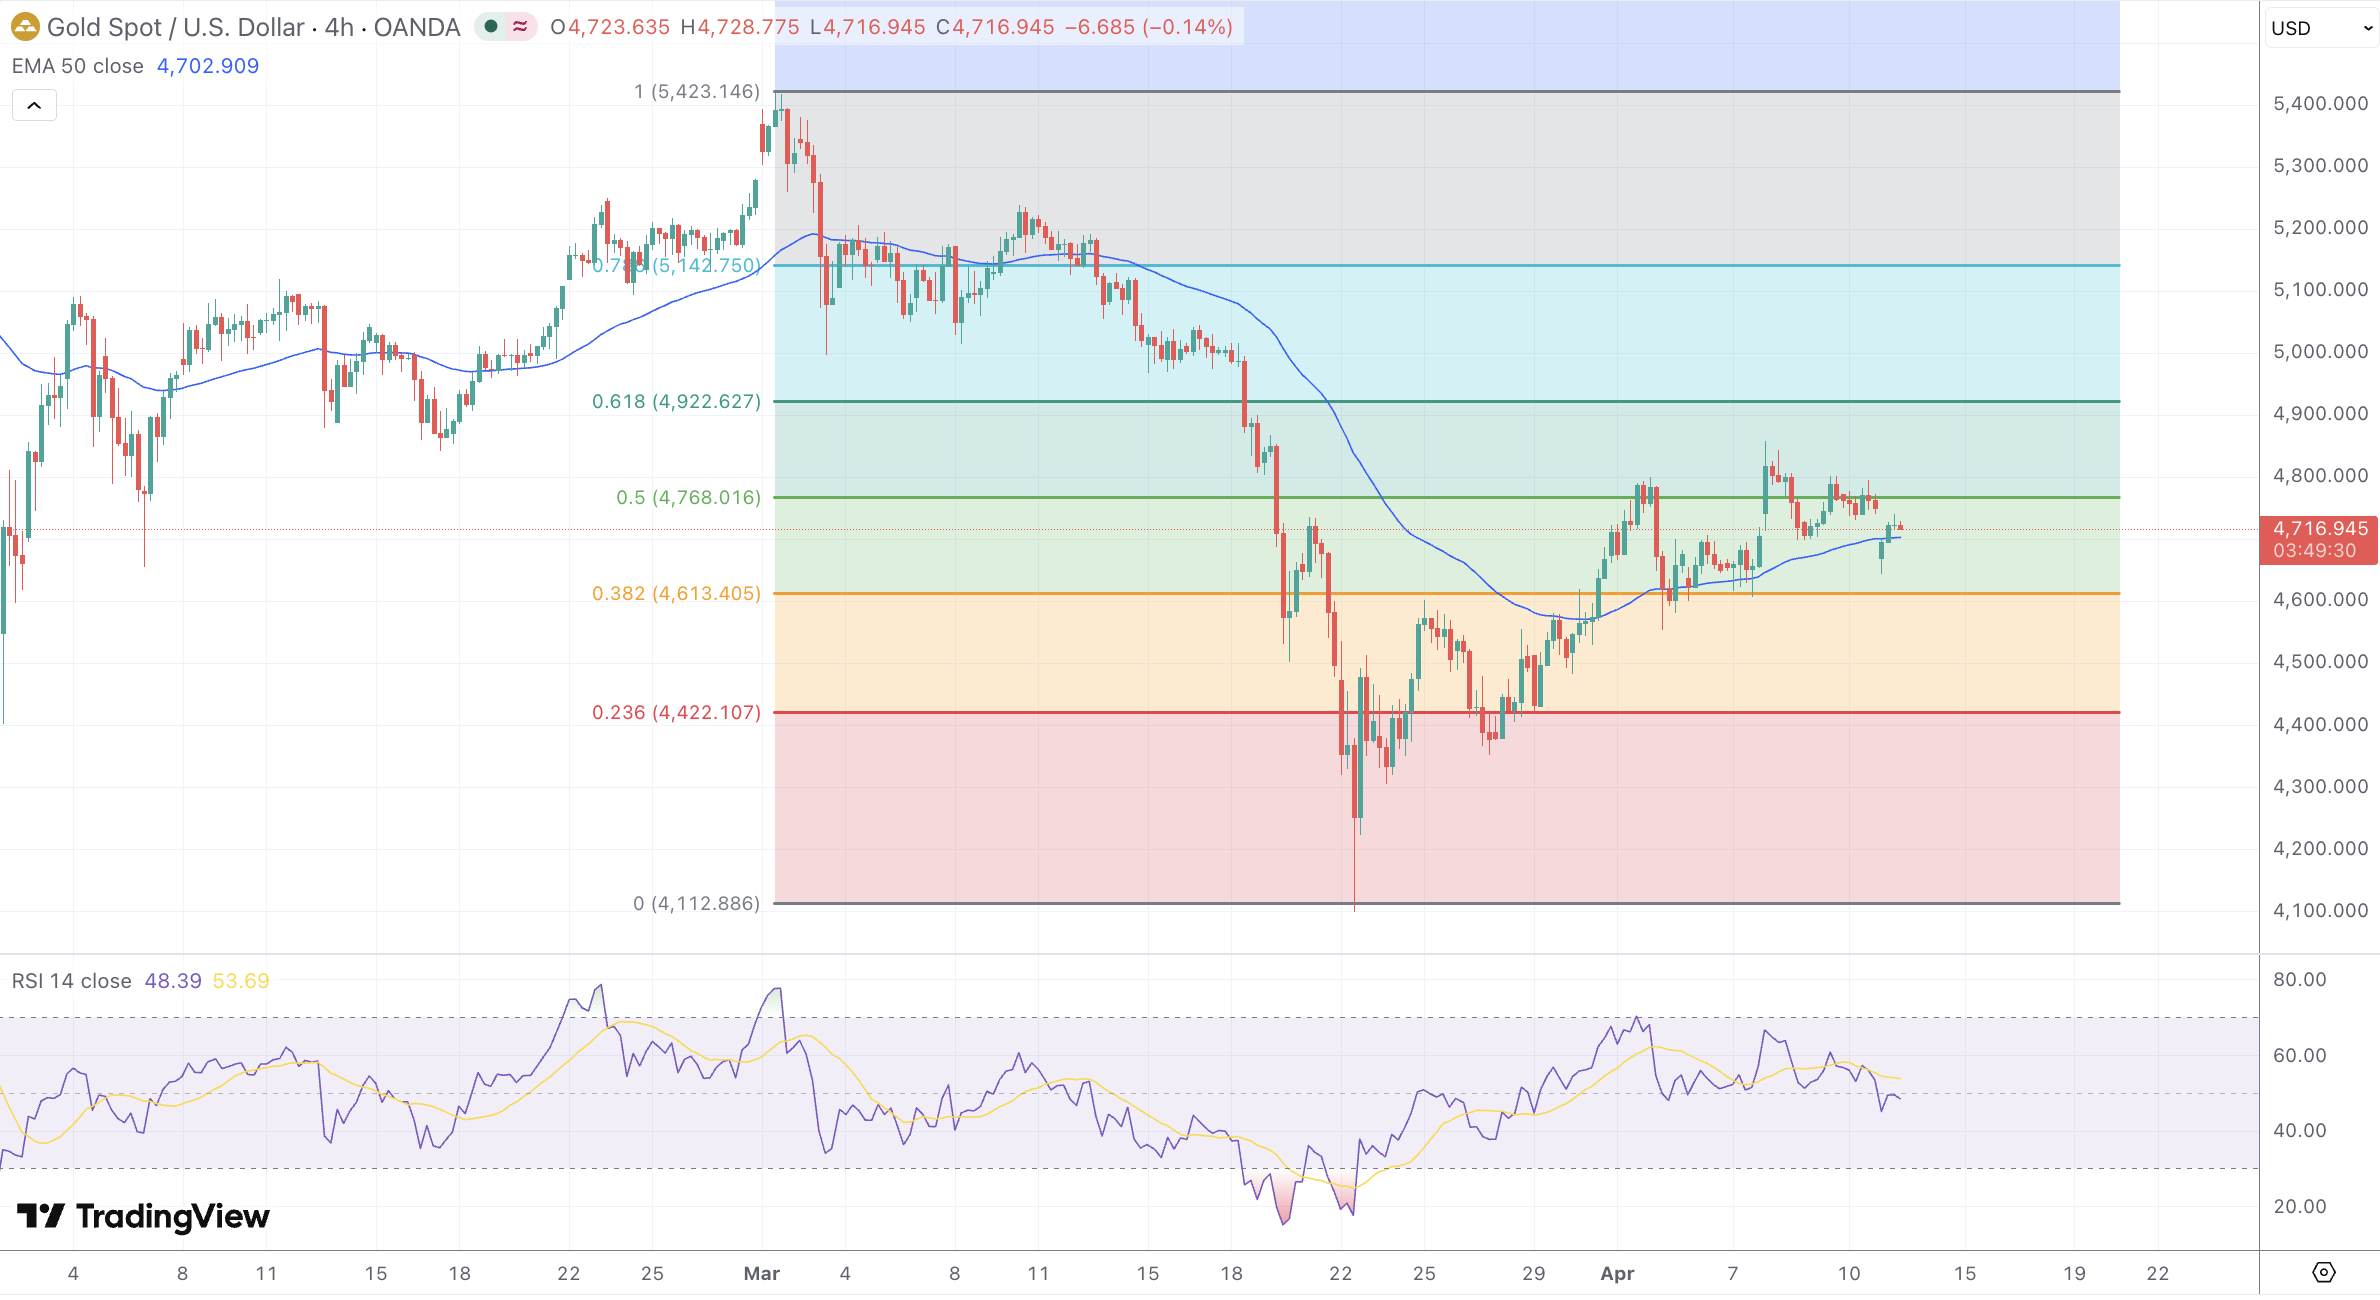
The RSI(14) on the 4-hour chart reads 50 against a signal line of 54, technically neutral but slightly bearish as the fast line sits below its signal. The RSI traced a full arc from below 20 in mid-March to above 65 at the April 8 high, making the current reading a mid-cycle consolidation rather than an exhaustion signal. The daily MACD has slipped marginally into negative territory at -12.36, confirming fading upside momentum, though histogram contraction hints the bearish impulse is itself softening.
The 5-day EMA at $4,694 has crossed below the 50-day EMA at $4,747, reinforcing near-term softness, while the 200-day EMA at $4,474 continues trending higher and confirms the multi-month bullish structure. Bollinger Bands on the weekly timeframe have printed price above their midline since 2024, a structural bullish signal, though the absence of a recent upper-band breakout reflects the current consolidation. Parabolic SAR remains bullish on the daily with dots trailing below price, while on the 4-hour timeframe SAR dots have migrated closer to spot following the $4,855 pullback. ATR holds elevated at roughly 85-90 points per session and ADX above 25 confirms a trending regime, though directional strength is softening from March peaks. OBV surged through the recovery phase but has levelled off alongside price, suggesting buyers are waiting for a fresh catalyst.
US CPI for March printed at 3.3% year-on-year, the highest since May 2024, with the monthly index jumping 0.9%. CME FedWatch now places the probability of an April rate cut at 0%, with December 2026 markets pricing only a 30% chance of a single 25-basis-point reduction. This hawkish recalibration acts as a near-term ceiling on gold. March PPI data, due April 14, is the first major catalyst of the week; a hot print would compound that pressure. The Fed Beige Book on April 15 follows. Geopolitically, the ceasefire framework remains fragile: Israel’s Lebanon operations are explicitly excluded, Hormuz transit restrictions are unresolved, and follow-on talks involving Israel and Lebanon are scheduled in Washington this week. Any breakdown in diplomacy would likely reignite the safe-haven bid toward $4,850-$4,900.
Looking Forward
The constructive structural case rests on three consecutive weekly gains, price holding above the 50.0% Fibonacci retracement, and durable central bank demand. Institutional forecasts from JPMorgan and Goldman Sachs continue to bracket gold within a $4,000-$6,300 range for 2026. The tactical risk case centres on the MACD’s negative crossover, RSI below its signal, and a macro backdrop that is more inflationary than markets anticipated two weeks ago. A hot PPI print could push gold down to the $4,650-$4,700 demand zone, with a break below $4,595 representing a technically significant deterioration.
The most probable near-term scenario is range trading between $4,650 and $4,860 as markets digest the data docket and monitor ceasefire developments. A re-escalation in the Middle East or a dovish Fed surprise could propel gold through $4,883 and reopen the path toward $5,000. Conversely, a durable ceasefire extension combined with hot inflation data could pull price back toward $4,595, the 38.2% retracement of the full March-April recovery.