Key Takeaways
- Gold trades around $4,059, testing critical support near $4,040 after correcting from the $4,381 record high, maintaining year-to-date gains exceeding 60 percent
- Technical indicators show overbought RSI conditions on higher timeframes while the four-hour chart suggests short-term bearish potential, with key support at $4,000-3,945 and resistance at $4,150-4,220
- The Federal Reserve’s October 28-29 meeting carries 98 percent probability of a 25 basis point rate cut, lowering gold’s opportunity cost and supporting precious metals
- Escalating US-China trade tensions with 100 percent tariff threats effective November 1 and rare earth export restrictions are driving substantial safe-haven flows
- Central bank demand remains structurally supportive, with China, India, and Germany continuing monthly purchases as part of reserve diversification strategies
- Bullish breakout above $4,150 could target $4,220-4,275 initially with extensions toward $4,675, while bearish breakdown below $4,040 would expose $4,000 and possibly $3,935
Market Dynamics and Recent Performance
Gold markets have experienced extraordinary volatility throughout October 2025, reaching an unprecedented peak of $4,381 per troy ounce on October 21 before undergoing a sharp correction. XAU-USD currently trades around $4,059, representing a year-to-date gain exceeding 60 percent, gold’s strongest annual rally since 1979.
The recent pullback has been characterized by profit-taking, with the precious metal experiencing its steepest single-day decline in over five years on October 22. Despite the retracement, the broader trend remains constructive, with gold hovering near the psychologically significant $4,000 level. The current consolidation reflects market repositioning ahead of the Federal Reserve’s October 28-29 monetary policy meeting, where policymakers must render their interest rate decision without crucial employment data due to the ongoing US government shutdown.
Technical and Fundamental Influences
XAU-USD has entered a symmetrical triangle pattern on the four-hour chart, establishing a critical trading range between $4,040 and $4,150. Currently positioned near the lower boundary at $4,059, gold faces an important technical juncture. A decisive break below $4,040 would expose the psychologically significant $4,000 level, with further downside extending toward the October 9-10 lows around $3,945. Conversely, a move above $4,150 would strengthen prospects for a pronounced rebound.
The Relative Strength Index remains elevated above 70 on daily and weekly timeframes, indicating overbought conditions despite the recent correction. However, the four-hour RSI has retreated to the 30-50 range, suggesting continued short-term bearish potential. Moving averages remain in bullish alignment, with Bollinger Bands widening significantly across all timeframes, confirming heightened volatility and strong directional bias.
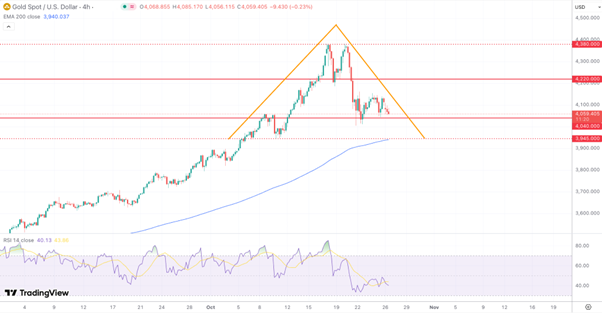
Key resistance levels sit at $4,150, followed by the former support zone near $4,220. A sustained move above these barriers would strengthen prospects for retesting the $4,380 record high. Technical projections point toward potential targets in the $4,675-4,900 range based on Fibonacci extensions from the ascending channel structure.
The Federal Reserve’s anticipated 25 basis point rate cut carries approximately 98 percent probability according to CME FedWatch calculations. Such easing reduces gold’s opportunity cost while pressuring the US dollar. Market participants have also priced in substantial likelihood of another quarter-point reduction in December at 90 percent probability, creating a favorable environment for non-yielding assets.
US-China trade tensions have escalated dramatically, providing the most significant driver of safe-haven demand. President Trump’s announcement of 100 percent tariffs on Chinese imports effective November 1, coupled with China’s export restrictions on rare earth elements, has ignited fears of full-scale economic confrontation. Central bank gold purchases remain structurally supportive, with the People’s Bank of China recording its eleventh consecutive monthly purchase, while India and Germany continue increasing reserves.
Looking Forward
The week ahead promises significant volatility as markets digest the Federal Reserve’s policy decision. Chairman Powell’s October 29 press conference will be scrutinized for signals regarding future rate adjustments. Any dovish surprises could propel gold toward retesting the $4,150 resistance and beyond, while hawkish rhetoric might trigger a test of the $4,000 support level.
In a bullish scenario, gold could rally above $4,150, initially targeting $4,220-4,275 before potentially extending toward $4,675 if momentum accelerates. The bearish alternative envisions breakdown below $4,040, exposing $4,000 and potentially triggering cascading technical selling toward $3,935-3,945. Further weakness could extend to $3,825, representing the ascending channel’s lower boundary that has defined the rally structure.
Near-term catalysts include the November 1 tariff implementation and October 30 US third-quarter GDP data. Stronger GDP growth could pressure prices, while weak figures would reinforce safe-haven demand. Exchange-traded fund flows show substantial inflows, particularly from US and Asian investors, providing technical support by reducing available physical supply.
The interplay between real interest rates and gold remains paramount. With inflation at 2.9 percent and Fed rates potentially declining to 3.75-4.00 percent, real yields continue trending lower, creating increasingly favorable conditions for precious metals. Longer-term projections from major institutions forecast gold averaging well above $4,000 through year-end, with several analysts targeting $4,900-5,000 by late 2026.