Key Takeaways
- XAU/USD currently trading at $4,247, up 0.74% on the session with an intraday range of $4,205 to $4,256
- The 50-period SMA at $4,040 provides solid trend support approximately $207 below current prices
- MACD (12,26) readings show 10.396/49.166/38.770, remaining in positive territory though momentum is stabilizing
- Markets are pricing an 87% probability of a Fed rate cut at the December 9-10 meeting, up from 71% a week ago
- Key support levels: $4,200 (psychological), $4,100, and $4,040 (50 SMA); resistance at $4,250 (November high) and $4,380-$4,400 (record zone)
- Target range for end of December: $4,310 to $4,339
- Central bank demand remains robust, with China resuming purchases and Poland leading European buyers with 67 tonnes in 2025
- Key data releases this week include ISM Manufacturing PMI, initial jobless claims, and University of Michigan inflation expectations
Market Dynamics and Recent Performance
Gold has staged an impressive rally heading into December, with XAU/USD currently trading at $4,247, up 0.74% (+$31) on the session. The pair opened at $4,226, reaching an intraday high of $4,256 and a low of $4,205, positioning the precious metal within striking distance of its all-time high near $4,400 set in mid-October. The yellow metal has posted remarkable gains of nearly 59% over the past twelve months, with November seeing the pair rise more than 2% on a weekly basis alone despite quieter trading conditions during the Thanksgiving holiday period.
Looking at the daily chart, the dramatic price action throughout 2025 becomes evident. From levels around $3,300 in early August, gold embarked on a powerful rally that culminated in the October peak above $4,400. The subsequent correction found support near the $3,850-$3,900 zone in late October and early November, before buyers stepped back in to drive the recovery that continues today.
Trading activity has been robust, with average gold trading volumes reaching $329 billion per day during the first half of the year, marking the highest semi-annual figure ever recorded. This surge in liquidity reflects growing institutional participation and heightened investor interest in precious metals as a portfolio diversification tool. The metal has now posted gains in seven of the past eight quarters, underscoring the durability of the current bull cycle.
Technical and Fundamental Influences
From a technical standpoint, XAU/USD presents a decidedly bullish picture on the daily timeframe. The 50-period Simple Moving Average stands at $4,040, positioned well below the current price of $4,247, confirming the underlying uptrend remains intact. This moving average has acted as dynamic support throughout the rally and currently provides a buffer of approximately $207 beneath spot prices.
The MACD indicator (12, 26, close) displays readings of 10.396 for the MACD line, 49.166 for the signal, and 38.770 for the histogram. While the indicator remains in positive territory, the histogram bars visible on the chart show a transition from deeper teal (bullish momentum) to lighter shading in recent sessions, suggesting some deceleration in upside momentum. This is not uncommon following a strong recovery move and may indicate consolidation before the next directional push.
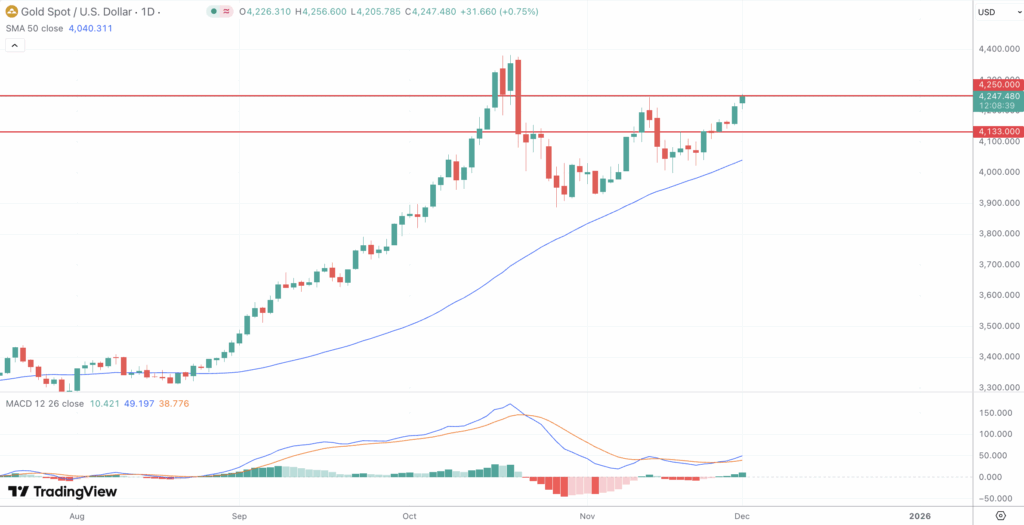
Price structure reveals that after the sharp October correction from above $4,400 to approximately $3,850, gold has carved out a series of higher lows, establishing a constructive base for further advances. The recovery rally has now reclaimed the $4,200 level, with the current session testing toward $4,256. Immediate resistance appears at the November high around $4,245-$4,250 zone, with a breach of this level opening the path toward retesting the October record peak near $4,380-$4,400.
On the downside, initial support rests at the $4,200 psychological level, followed by the $4,100 area. The 50 SMA at $4,040 represents a critical support zone that bulls will want to defend. A sustained break below this moving average would signal a potential shift in near-term sentiment and could expose the $3,900-$3,850 support region that contained the November pullback.
The fundamental backdrop continues to favor gold accumulation. Markets are now pricing in an 87% probability of a 25-basis-point rate cut at the Federal Reserve’s December 9-10 meeting, up significantly from approximately 71% just one week ago. This shift in expectations follows dovish remarks from several Fed officials, including Governor Christopher Waller and San Francisco Fed President Mary Daly, who both indicated support for continued monetary easing given the weakening labor market conditions.
The benchmark 10-year Treasury yield has declined to 4.017%, providing additional tailwinds for non-yielding assets like gold. Lower interest rates reduce the opportunity cost of holding bullion, making the precious metal more attractive relative to fixed-income alternatives. The U.S. Dollar Index has experienced its weakest annual performance since 2003, down approximately 10% by end of September, which has boosted dollar-denominated commodity prices.
Central bank purchasing remains a cornerstone of structural demand. According to the World Gold Council’s latest survey, an overwhelming majority of central banks plan to expand their gold reserves, with none expecting to reduce holdings despite record prices. The People’s Bank of China resumed purchases after a six-month pause, once again becoming the largest buyer of the precious metal. The National Bank of Poland leads 2025 purchases with 67 tonnes, while Turkey and Kazakhstan maintain steady additions to their reserves.
Geopolitical tensions continue to provide a floor under gold prices. The ongoing conflict in Ukraine, unrest in the Middle East, and strained U.S.-China relations have elevated gold’s role as the premier safe-haven asset. However, traders should note that any unexpected de-escalation in these conflicts could trigger profit-taking and temporary downside pressure.
Looking Forward
This week brings several key macroeconomic releases that could significantly impact XAU/USD price action. The U.S. ISM Manufacturing Purchasing Managers Index for November, scheduled for release on Monday, will provide insights into the health of the manufacturing sector. A drop in PMI would signal economic slowdown, potentially supporting gold prices. Initial jobless claims data on Thursday and the University of Michigan inflation expectations for December on Friday round out the week’s high-impact events.
The target range for gold by the end of December stands at $4,310 to $4,339, according to current projections. However, moderate volatility is expected this week as markets digest key macroeconomic releases and speeches from FOMC members. Traders should remain nimble heading into these data releases, as any upside surprises could temporarily strengthen the dollar and cap gold’s advances.
The chart pattern suggests gold is attempting to break higher after consolidating gains from the November recovery. The diminishing MACD histogram bars indicate momentum is stabilizing, which could precede either a continuation higher or a period of range-bound trading before the next catalyst emerges. The constructive price structure above the rising 50 SMA supports the bullish bias as long as this key moving average holds.
The overall bias remains tilted to the upside as long as the market maintains expectations for a December rate cut and the Fed does not push back against this pricing. Short-term pullbacks are likely to find buying interest near established support levels, particularly the $4,100-$4,040 zone where the 50 SMA resides. If the Fed delivers the quarter-point reduction on December 9-10, gold has a clear path to retest its October peak near $4,400.
Risk factors to monitor include any sudden improvement in risk appetite or positive headlines regarding Russia-Ukraine diplomatic efforts, which could diminish safe-haven demand. Additionally, a stronger-than-expected U.S. economic data release could alter rate cut expectations and trigger profit-taking.