Key Takeaways
- XAU/USD currently trades at $4,668, up 1.56% on the session, after reaching a fresh all-time high of $4,690 with twelve-month appreciation approaching 70%.
- Key resistance levels stand at today’s high of $4,690 and the psychological $4,700 handle, while critical support zones include $4,646 (session low), $4,549 (9-day EMA), $4,381 (former October high), and the psychological $4,000 level.
- The RSI at 64.37 indicates bullish momentum with room to extend before reaching overbought extremes at the 71.42 threshold.
- Federal Reserve independence concerns following the DOJ investigation into Chair Powell have fueled safe-haven demand and contributed to the “sell-America” trade dynamic.
- The economic calendar this week features Trump’s speech (Jan. 21), US GDP data and jobless claims (Jan. 22), PMI releases (Jan. 23), and culminates with the Fed rate decision (Jan. 26).
- Central bank purchasing, geopolitical uncertainty, and expectations for Fed easing continue to provide structural support, with analyst forecasts ranging from $4,500 to above $5,000 for 2026.
Market Dynamics and Recent Performance
Gold has extended its remarkable rally into the third week of January, with XAU/USD currently trading at $4,668, up $71.77 or 1.56% on the session. The yellow metal reached a fresh all-time high of $4,690.940 earlier today, while the session low held at $4,646 after opening at $4,649. The precious metal has now appreciated roughly 70% over the past twelve months, marking one of its strongest performances since 1979. The bullish momentum that characterized the second half of 2025 has carried forward into the new year, underpinned by a confluence of geopolitical uncertainty and monetary policy concerns.
The precious metal surged above $4,600 per ounce on January 12, fueled by intensified concerns over Federal Reserve independence following reports that the Department of Justice had served grand jury subpoenas to Fed Chair Jerome Powell. This development escalated an already contentious relationship between the White House and the central bank, prompting what analysts have described as a “sell-America” trade. Investors rapidly moved into safe-haven assets, pushing spot gold to a then-record high of $4,629.94 before the rally extended further into uncharted territory.
Last Friday’s session saw gold register losses of over 0.70% as traders engaged in profit-taking, with the pair retreating to around $4,580. President Trump’s remarks indicating reluctance to nominate Kevin Hassett for the Federal Reserve chairmanship added an element of uncertainty, as Hassett had been viewed as a dovish contender to succeed Powell. Swap traders subsequently priced in slightly reduced odds of two quarter-point rate cuts by the Fed this year, placing some downward pressure on non-yielding bullion. However, the market has rebounded strongly into today’s session, reclaiming the $4,660 level and testing new highs.
Technical and Fundamental Influences
From a technical perspective, XAU/USD continues to trade within a well-defined bullish structure, maintaining a sequence of higher highs and higher lows. The pair currently sits comfortably above both its 50-day simple moving average at $4,296.20 and the 200-day SMA at $3,866.37, reinforcing the constructive longer-term outlook. The 14-period Relative Strength Index stands at 64.37, elevated but not yet in extreme overbought territory, suggesting there remains room for further upside momentum before exhaustion signals emerge.
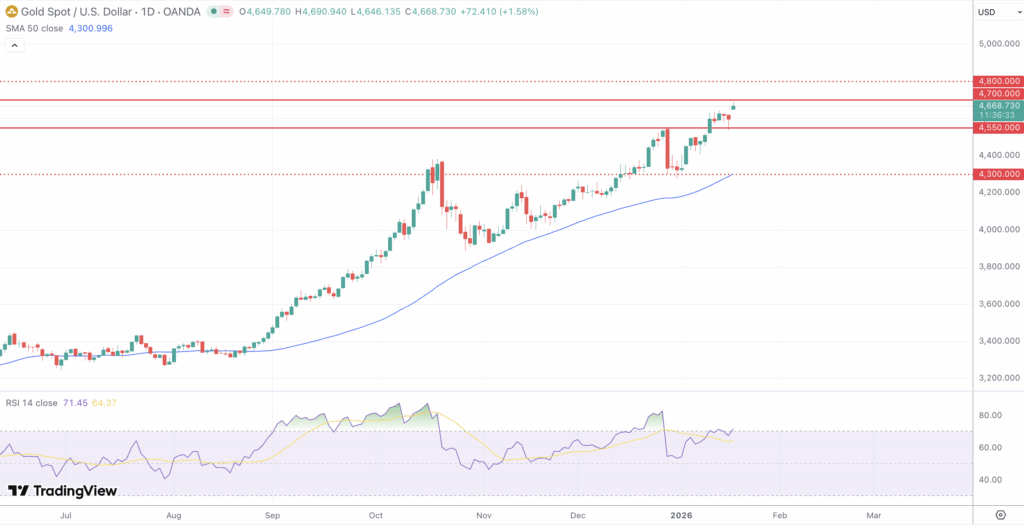
Key resistance levels to monitor this week include today’s fresh all-time high at $4,690.94, followed by the psychological $4,700 handle. A decisive break above this confluence could open the path toward $4,800, with further extensions potentially targeting the much-discussed $5,000 milestone that several major banks have projected. The 1.618% Fibonacci extension of the December 2024 advance positions around $4,603, which has now been cleared and serves as near-term support.
On the support side, immediate protection lies at the 9-day exponential moving average around $4,549, followed by the $4,520 level which coincides with an ascending wedge boundary visible on the daily chart. Today’s session low at $4,646.13 establishes the first intraday support reference. The former October high at $4,381 has transitioned into a meaningful support zone, while the $4,300 area represents a key neutrality level aligned with prior all-time highs. The psychological $4,000 level remains the critical line in the sand; a break below this threshold would signal a significant shift in the broader bullish structure.
The RSI reading at 64.37 indicates bullish momentum without yet reaching overbought extremes, with the upper threshold sitting at 71.42. This positioning suggests the rally still has technical room to extend before a meaningful correction becomes likely. The MACD has shown a bullish crossover with the histogram moving above the neutral zero line, confirming that short-term momentum has shifted favorably. However, the developing ascending wedge pattern on the daily chart warrants attention, as it traditionally indicates fading upside momentum and carries the risk of a bearish reversal should prices break below the lower trendline on strong volume.
Fundamentally, the gold market continues to draw support from multiple sources. Central bank purchasing remains a cornerstone of demand, with institutions diversifying away from dollar-denominated assets amid sanctions risk, rising fiscal deficits, and geopolitical fragmentation. Projections suggest national bank gold purchases could average 70 tons per month throughout 2026. The softer US inflation data released in mid-January, showing core CPI cooling to 0.2% month-over-month and 2.6% year-over-year, has reinforced expectations that the Fed will eventually ease policy, reducing the opportunity cost of holding non-yielding assets like gold.
Looking Forward
The week ahead brings several catalysts that could drive significant price action in the gold market. President Trump’s speech on January 21 stands as a key event, with traders assessing potential policy announcements and their implications for inflation, trade relations, and overall economic direction. The Supreme Court is also expected to issue a critical ruling regarding the “for-cause” removal of independent agency officials, stemming from a challenge involving Fed Governor Lisa Cook. A ruling favoring the administration could trigger a further decline in the US dollar and potentially propel gold toward the $5,000 mark.
US GDP data scheduled for release on January 22, alongside initial jobless claims, will provide important insight into the health of the American economy. The following day brings the Purchasing Managers’ Index readings for both services and manufacturing sectors, as well as the University of Michigan inflation expectations survey. These figures will help shape market expectations ahead of the Fed’s interest rate decision on January 26, where officials are widely expected to hold rates steady at the 3.50%-3.75% range.
Geopolitical tensions continue to provide a supportive backdrop for safe-haven demand. The situation in Iran, where nationwide demonstrations have entered their third week with reports of significant casualties, remains fluid. Meanwhile, tensions between the United States and Venezuela, along with ongoing discussions regarding Greenland, add layers of uncertainty that typically favor gold. The Russia-Ukraine conflict continues in the background, with any escalation or de-escalation potentially moving prices in either direction.
While the structural bullish case for gold remains intact, some analysts caution that the rally could be running thin on fresh fuel. After a 65% gain in 2025, the metal may be heading toward a period of consolidation rather than a repeat of last year’s explosive performance. Price currently sits more than $1,100 above the 52-week moving average, suggesting an overheated condition that historically precedes corrective phases. However, as long as the series of higher highs and higher lows remains intact and key support levels hold, the path of least resistance continues to favor the upside.