Key Takeaways
- EUR/USD is trading at $1.1686 after a ceasefire-driven rally from $1.1550 to near $1.1750, now in a corrective consolidation phase on the 4-hour chart.
- The 4-hour RSI reads 56.55 (close) with the signal at 64.31, above neutral 50 but cooling; the MACD histogram is compressing toward a bearish cross within the broader uptrend.
- The Parabolic SAR remains bullish with dots below price near $1.1640; the 5-day, 50-day, and 200-day EMA complex is in a bullish stack; OBV and ADX confirm trend participation.
- Fibonacci support sits at $1.1665 (38.2%), $1.1623 (50%), and $1.1557 (78.6%); resistance at $1.1742 (50%), $1.1820 (61.8%), and the $1.1830 to $1.1870 cluster.
- ECB hike probability for April 30 has surged above 80% following hawkish Governing Council commentary, creating direct policy divergence against the Fed’s hold-to-cut stance.
- FOMC minutes this week are the primary short-term catalyst; tone will determine whether EUR/USD finds a floor at $1.1623 or extends toward $1.1820.
- The structural bias remains bullish while $1.1480 holds on a weekly close, with institutional year-end consensus in the $1.20 to $1.25 range.
Market Dynamics and Recent Performance
EUR/USD enters the week of April 13 trading at $1.1686, having completed one of its most violent short-term rallies of the year. The pair spent the better part of late March and early April grinding between $1.1407 and $1.1628 before exploding higher in the first week of April when a US-Iran ceasefire announcement triggered a broad dollar selloff, sending the pair surging through $1.1650 in the Asian session and printing a high near $1.1750.
The catalyst was geopolitically decisive. Just ahead of his own ultimatum deadline, President Trump announced a two-week ceasefire with Iran, brokered through Pakistani mediation and accepted by Israel. The news crushed safe-haven dollar demand overnight. Oil prices eased from elevated triple-digit levels, relieving one of the primary headwinds that had weighed on the euro for weeks. The ceasefire flipped those dynamics rapidly, though traders remain cautious: the agreement is temporary, the Strait of Hormuz situation remains fragile, and any breakdown in negotiations could swiftly reverse the move.
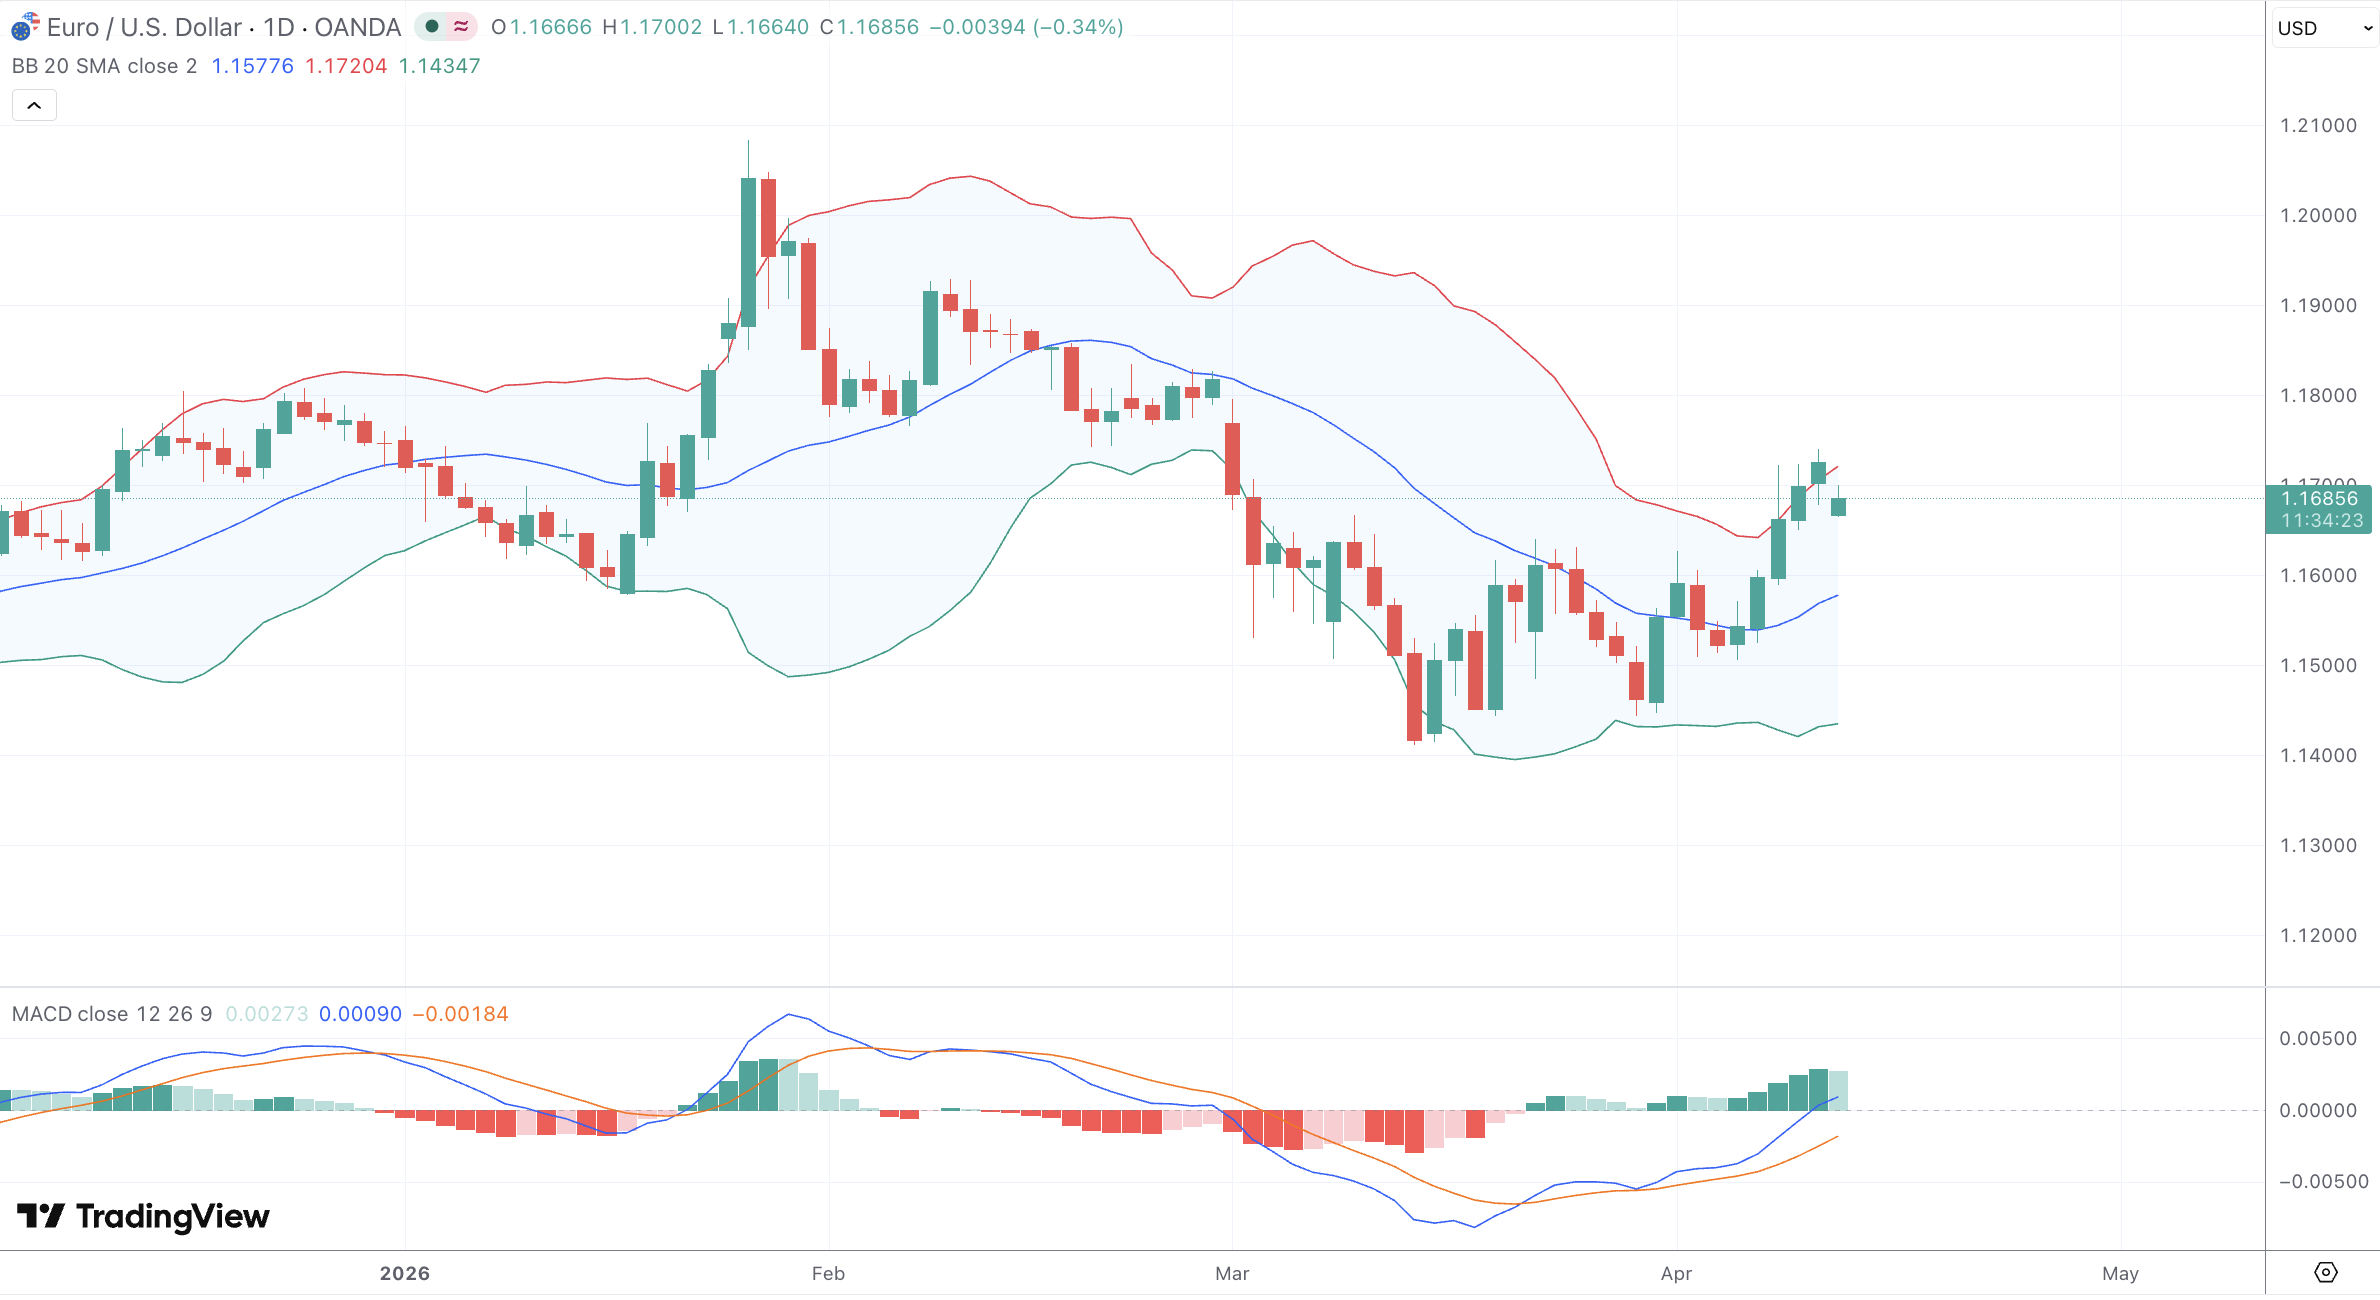
The 4-hour chart captures this shift clearly. Following the surge from $1.1550 toward $1.1750, the pair is now in a measured pullback, with the current candle printing an open of $1.1686, a high of $1.1700, a low of $1.1678, and a close of $1.1686. Price has settled just above the $1.1650 zone that previously acted as multi-week resistance and now serves as the first meaningful support on the structure.
Technical and Fundamental Influences
The RSI 14 on the 4-hour chart reads 56.55 on the close line with the signal at 64.31, indicating momentum has pulled back from overbought conditions seen during the spike but remains constructive above the neutral 50 threshold. The crossover of the RSI below its signal line is a short-term caution flag, not a reversal signal, provided price holds above $1.1650. The MACD histogram is compressing toward a bearish cross after confirming the rally with a positive expansion, consistent with corrective consolidation rather than trend failure.
From the Fibonacci structure drawn off the January-to-March decline, the 38.2% retracement at $1.1665 briefly acted as the 200-day SMA confluence before being breached during the surge. The 50% retracement at $1.1742 capped the spike high, and the 61.8% level at $1.1820 is the next upside target on the weekly structure. Above that, $1.1830 to $1.1870 forms a dense resistance cluster from prior swing highs and the upper Bollinger Band boundary. Support is layered at $1.1650, then $1.1623 (50% retracement of the recent leg), and $1.1557 (78.6%), below which the near-term bullish thesis is materially weakened.
The 5-day, 50-day, and 200-day EMA complex remains in a bullish stack. The Parabolic SAR on the daily chart flipped bullish during the ceasefire rally with dots printing below price and has not reversed, providing trailing support near $1.1640. OBV rose sharply during the spike, confirming the move was backed by genuine volume participation. ADX on the daily chart has climbed above 25 following the breakout, confirming a trending environment. Candlestick analysis shows a Shooting Star formed near the rally high at the upper Bollinger Band, with subsequent doji-like candles signalling indecision while the market awaits fresh catalysts. ATR remains elevated, pointing to wider-than-average intraday ranges this week.
On the fundamental side, the ECB is providing a powerful second engine for euro strength. Governing Council member Yannis Stournaras stated earlier this month that if the energy shock filters into inflation expectations and wage growth, the ECB will need to consider tightening. Money markets moved swiftly, pricing probability of an ECB hike at the April 30 meeting above 80%, a sharp repricing that directly contrasts the Federal Reserve’s posture.
The Fed held rates at its most recent meeting while futures continue to price modest probability of eventual easing later in 2026, though strong US labour data has trimmed those expectations. FOMC minutes from the March meeting are due this week and will be scrutinised for how committee members are weighing the inflationary impact of elevated oil prices. Hawkish minutes could cap EUR/USD temporarily; a dovish read would reinforce the bullish case. Structurally, with the ECB leaning toward tightening and the Fed at best on hold, the yield spread dynamic continues to tilt in the euro’s favour. The DXY has shed close to 10% year-on-year, providing the macro backdrop against which EUR/USD has sustained its advance from the $1.04 lows, with major bank consensus clustering around $1.20 to $1.25 as year-end targets.
Looking Forward
The near-term path hinges on two binary risks: the durability of the US-Iran ceasefire and the tone of this week’s FOMC minutes. If the ceasefire holds, the relief trade has room to extend toward $1.1820 and the $1.1830 to $1.1870 resistance cluster, with a confirmed weekly close above $1.1870 opening the pathway to $1.1930 and ultimately $1.2000. The immediate tactical scenario is a corrective pullback toward $1.1650 to $1.1623, where the 50% Fibonacci level and horizontal support converge. A defence of that zone would establish a higher-low formation on the 4-hour chart and set up continuation toward $1.1742 and beyond. A loss of $1.1557 would neutralise the near-term bullish case and bring $1.1480 to $1.1500 back into focus.
The ECB meeting on April 30 is the dominant calendar risk for the euro. A confirmed hike or explicit forward guidance in that direction would likely send EUR/USD gapping higher at the open of that week. A more cautious tone walking back current expectations would challenge $1.1623 to $1.1557 support sharply. On the US side, any labour or inflation data materially above consensus this week could trigger a temporary USD bid, though the structural trend remains intact while $1.1480 holds on a weekly closing basis.