

Key Takeaways
- Bitcoin is trading at $70,622, having rejected sharply from the $74,000 resistance after a macro-driven rally from $65,000 in early April
- The 4-hour RSI of 41.65 sits below its signal line of 52.88, confirming bearish momentum; the Parabolic SAR has flipped above price on the 4-hour chart, generating a sell signal
- The MACD on the daily frame reads approximately -373, consistent with a market in corrective mode; the MACD signal lines are converging on the downside
- Critical Fibonacci support at the 38.2% retracement of $71,780 is under pressure; a daily close below $70,500 opens the path to $68,000 to $69,554 (50% and 61.8% retracements)
- The 200-day EMA at $69,607 represents the structural floor; a weekly close below this level would be a significant bearish signal
- Upside resistance is layered between $71,766 and $72,031 (5-day EMA and Fibonacci convergence), with a key breakout level at $72,500 and major resistance at $74,000 to $74,300
- The SEC CLARITY Act roundtable on April 16 is the primary catalyst event of the week; Polymarket gives 72% odds of 2026 passage
- S.-Iran ceasefire expires around April 21; any deterioration in that situation would reintroduce oil risk premium and dampen risk appetite
- Whale addresses absorbed over 61,000 BTC in the past 30 days; stablecoin supply at a record $316 billion represents significant deployable capital on the sidelines
- The FOMC meeting on April 29 is a known risk event; recent FOMC meetings have been associated with Bitcoin price declines regardless of the decision
Market Dynamics and Recent Performance
Bitcoin enters the week of April 13 under renewed pressure, with the 4-hour chart printing a current price of $70,622 after trading as high as $73,988 and pulling back sharply from that resistance cluster. The latest candle shows an open at $70,846, a session high of $70,881, and a low of $70,584, confirming that sellers are firmly in control of short-term price discovery. The broader context is one of a market that surged aggressively from the $65,000 region in the first days of April, briefly reclaiming $74,000 before running into a wall of selling pressure that has since erased a meaningful portion of those gains.
April opened on a difficult footing. The so-called “Liberation Day II” tariff announcement on April 2 sent Bitcoin below $66,246, dragging the broader crypto market lower as risk assets were broadly liquidated. From that low, buyers staged a sharp reversal: a conditional U.S.-Iran ceasefire announced on April 9 released pent-up risk appetite, triggering a rally that carried Bitcoin above $73,000 within 48 hours. U.S. spot Bitcoin ETFs recorded $358 million in net inflows on April 9 alone, with BlackRock’s IBIT contributing $269 million in what was its strongest single-day intake since early March. That ETF demand helped validate the recovery, though the subsequent rejection at the $74,000 zone suggests the institutional bid remains conditional rather than unconditional.
March closed up 1.8%, ending a five-month losing streak, and provided the foundation for April’s attempted rally. Total cumulative ETF inflows now stand at approximately $53 billion, a figure that substantially exceeded the $5 to $15 billion analysts projected ahead of the January 2024 ETF approvals. Nevertheless, Bitcoin exchange reserves remain near 2.31 million BTC, an eight-year low, which underscores a structural supply tightening that continues to coexist with near-term bearish price action.
Technical and Fundamental Influences
On the 4-hour RSI, the current reading of 41.65 sits below the signal line of 52.88, confirming a bearish crossover that places momentum firmly in negative territory. This configuration is consistent with a market that has rolled over from overbought conditions and is now probing whether buyers have enough conviction to defend the $70,000 to $71,000 range. The daily RSI, per available aggregated indicator data as of April 13, reads in the 41 to 42 range, further corroborating the near-term bearish bias. On the MACD, the daily reading of approximately -373 with a sell signal on both the 5-hour and hourly frames suggests downward momentum has not yet been exhausted.
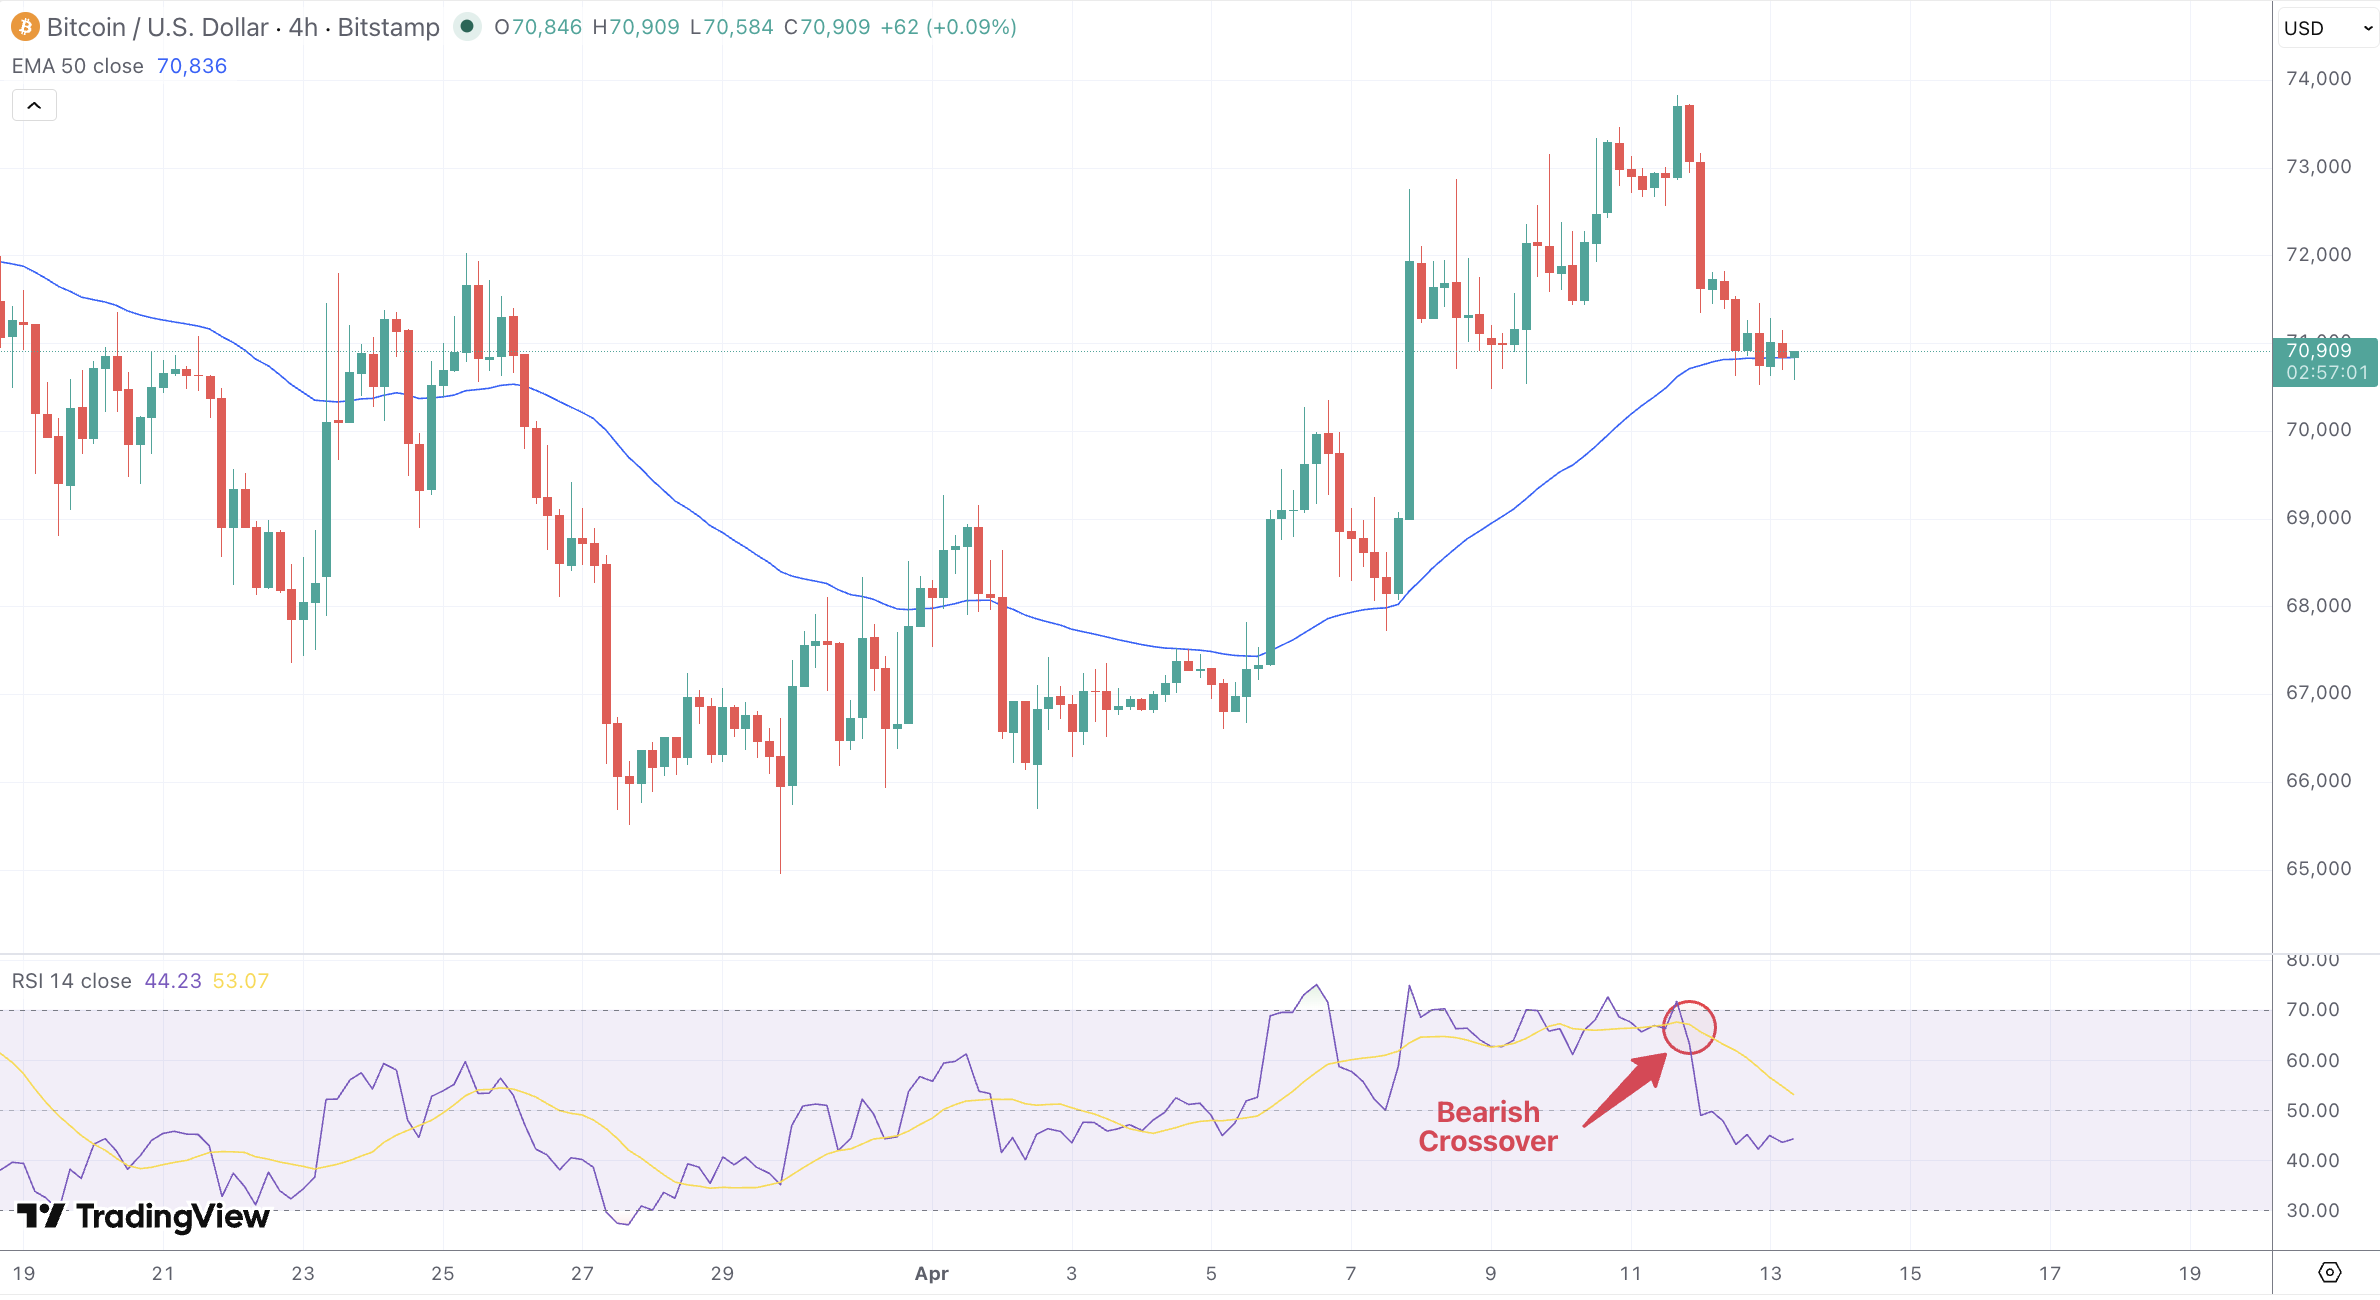
Moving averages on the daily chart paint a mixed picture. The 5-day EMA sits at roughly $71,091, currently acting as immediate resistance above the spot price, while the 50-day EMA near $72,031 represents the next meaningful ceiling. The 200-day EMA at approximately $69,607 is the critical floor to watch: price remains above it, but a close below would represent a major technical deterioration and would accelerate selling from systematic trend-following strategies. On the weekly timeframe, the 50-day moving average is positioned above price and falling, reinforcing that the medium-term structure remains bearish.
From a Fibonacci perspective, the rally from the early April lows to the $74,000 peak established a sequence of retracement levels that are now in play. The 38.2% retracement of that swing sits near $71,780, which provided initial support and represents the first meaningful defence for bulls. A breach of this level on a closing basis would target the 50% retracement near $70,000 and then the 61.8% level around $68,770. On the upside, the 23.6% retracement at approximately $71,766 has already acted as a rejection point on the most recent bounce attempt. A clean reclaim of $72,500 would invalidate the corrective thesis and bring the $73,388 to $74,300 resistance zone into focus once more. The Fibonacci pivot for the current session sits at $71,023 to $71,166, confirming that price is trading slightly beneath a structurally important cluster.
The Parabolic SAR on the 4-hour frame has flipped above price, generating a confirmed sell signal that reinforces the current corrective structure. The ADX reading, while not yet at extreme levels, indicates that directional momentum is building to the downside. Bollinger Bands have begun to contract following the volatility spike of the recent rally, suggesting that a directional move of consequence is likely before the week closes. The upper band sits near $74,300, and the lower band is positioned near $68,500, marking out the likely range of the coming sessions. On-Balance Volume has rolled over from its rally-period highs, indicating that volume participation in the most recent decline is increasing, which is a negative divergence worth monitoring.
From a candlestick pattern standpoint, the 4-hour chart shows a sequence of bearish engulfing candles after the $73,988 top, followed by doji formations near $70,600 that hint at indecision but have not yet produced a convincing reversal signal. The structure still resembles a bear flag developing below the 5-day EMA, and the measured move of such a pattern would project toward the $68,000 to $69,000 area if it resolves lower.
On the fundamental side, the macro backdrop remains challenging. The Federal Reserve is widely expected to hold rates steady at its April 29 meeting, with Polymarket pricing a 98% probability of no change. The hawkish FOMC meeting on March 18 triggered Bitcoin’s decline from $76,000 to below $65,000 in a matter of days, and the memory of that episode is likely keeping buyers cautious ahead of the next meeting. Tariff uncertainty persists: the existing 10% reciprocal tariff regime has been in place since Liberation Day, and the prospect of escalation to 15% continues to suppress risk appetite across asset classes. Geopolitical risk also remains live. The Iran ceasefire that catalysed April’s rally is set to expire around April 21, and reports that Iran claims three clauses of the agreement were violated have already begun to reintroduce an oil risk premium, with Brent crude rebounding and dampening the enthusiasm that carried Bitcoin to its weekly high.
Regulatory developments add another dimension. The SEC has scheduled a roundtable on the CLARITY Act for April 16, and the Senate Banking Committee markup is targeted for the second half of April. Polymarket odds for 2026 passage stand at 72%, but analysts warn that if the markup does not occur in April, passage probability drops sharply and institutional allocators waiting for regulatory clarity may push deployment timelines into 2027. Whale addresses holding between 10 and 10,000 BTC absorbed over 61,000 BTC in the past 30 days, representing a structurally bullish accumulation signal even as price corrects. Stablecoin supply hit a record $316 billion, maintaining a historically high ratio of deployable capital to available selling supply that has not been seen at any prior point in the asset class’s history.
Looking Forward
The week ahead is defined by a tight cluster of catalysts that could determine whether $70,000 holds or gives way. The immediate technical test is the defence of the 38.2% Fibonacci retracement at $71,780, a level that has already been violated on an intraday basis. A clean daily close beneath $70,500 would effectively confirm that the April rally has completed and shift the probability toward a retest of the $68,000 to $69,000 zone. The 200-day EMA near $69,607 represents the structural floor beneath that, and a weekly close below it would be a significant bearish development with implications for the broader month of April.
On the upside, recovery attempts will face resistance at the converged 5-day EMA and Fibonacci cluster between $71,766 and $72,031. A sustained reclaim of $72,500, ideally on elevated volume, would confirm a bull flag resolution and set up a retest of $74,000 to $74,300, which also corresponds to a key resistance identified by Investtech’s channel analysis. Beyond that, the next major technical objective is $76,000, the level Bitcoin touched in mid-March before the FOMC-induced selloff, and the approximate 78.6% Fibonacci retracement of the broader decline from the 2025 highs.
The April 16 CLARITY Act roundtable is likely to be the most market-moving event of the short-term calendar. A positive regulatory signal from the SEC could act as a significant catalyst for ETF inflows to resume at scale, given that many institutional allocators have explicitly linked deployment timing to the passage of a clear digital asset framework. Conversely, any ambiguity or delay in the markup process would likely weigh on sentiment and amplify the technical selling pressure already evident on the chart. The ceasefire expiry around April 21 also sits within the weekly window and warrants close monitoring: any headline suggesting the Strait of Hormuz remains effectively closed could trigger another round of energy-related risk aversion that would pressure Bitcoin in tandem with growth-sensitive equities.
The broader structure, despite the correction from $74,000, is not catastrophic. Bitcoin has recovered from below $66,000 to above $70,000 in the span of two weeks, a rally of roughly 6% from its April lows. The 200-day EMA remains below spot price. Whale accumulation continues. ETF infrastructure is absorbing an increasingly large share of new issuance, with projections suggesting ETFs could absorb more than 100% of new Bitcoin supply through 2026. If the macro environment stabilises even modestly, the structural supply deficit means that institutional re-entry, when it comes, is likely to be swift and material.