
Key Takeaways
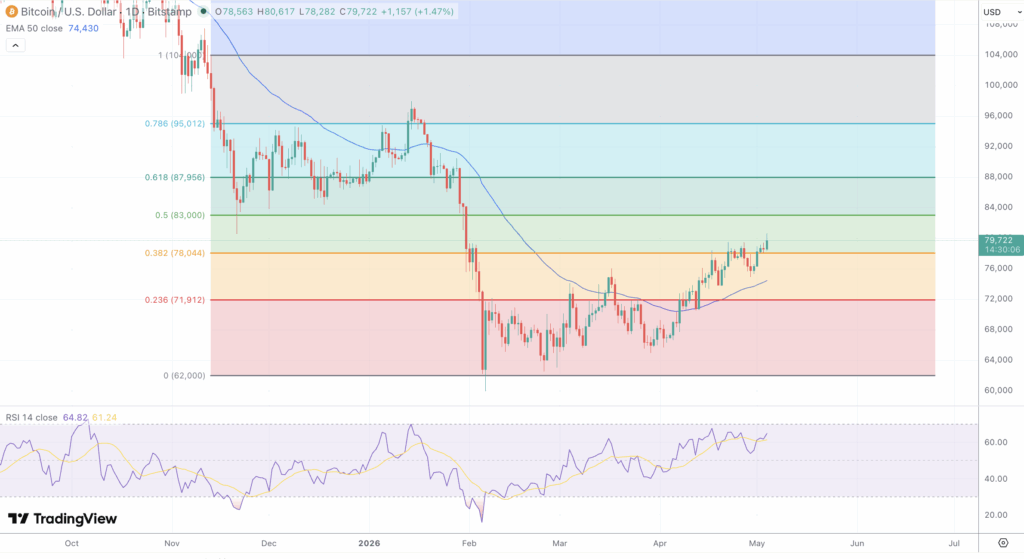
- BTC/USD is trading at $79,718, up 1.47% on the day, pressing against the $80,000 ceiling with intraday highs already reaching $80,617
- RSI(14) reads 64.81 against a signal line of 61.24, confirming bullish momentum while stopping short of overbought territory
- The MACD line at 1,675 has crossed above its 9-period signal at 1,672, producing a thin but positive histogram, a tentative bullish crossover requiring follow-through
- The 200-day EMA near $83,842 stands as the primary structural resistance and the level regarded as the true breakout confirmation trigger
- Spot Bitcoin ETF flows hit $630 million on May 1, the strongest single-day inflow of 2026, with April’s total reaching $2.44 billion, the best monthly figure of the year
- Strategy’s Q1 earnings on May 5 and the Federal Reserve leadership transition on May 15 represent the two most immediate event risks of the week
- A weekly close above $82,228 would signal a regime shift from range-bound recovery to directional uptrend; failure to hold $78,000 reopens the path toward $75,000
Market Dynamics and Recent Performance
Bitcoin enters the first full week of May in its most constructive posture since late 2025, trading at $79,718 after a session high of $80,617 and an intraday low of $78,282. The 1.47% daily gain reflects a meaningful acceleration within the higher-lows structure that has held since the February capitulation near $62,000. The recovery of roughly $17,700 from trough to present equates to a 28.5% rebound, though the asset remains approximately 23% below the $104,000 peak of the prior advance.
April was decisive in reestablishing institutional confidence. Bitcoin closed the month up 11.84%, its strongest monthly performance of 2026, supported by a surge in ETF demand. Spot Bitcoin ETFs attracted $2.44 billion in net inflows during April, nearly double March’s $1.32 billion. The pace accelerated further into May: the $630 million absorbed on May 1 alone was the largest single-day ETF inflow of the year. BlackRock’s iShares Bitcoin Trust led with $284 million and Fidelity’s FBTC contributed $213 million, together covering more than 79% of the day’s total. IBIT now holds upward of 806,000 BTC, approximately 3.8% of circulating supply, while lifetime cumulative ETF inflows stand at $58.55 billion with assets under management exceeding $102 billion.
On-chain data reinforces the bullish case. Bitcoin is rebounding near the average acquisition cost of capital that entered through spot ETFs in the earliest post-approval phase, a level functioning as a meaningful short-term support floor. OBV is trending upward, positive volume balance persists, and the Crypto Fear and Greed Index at 47 signals a Neutral reading, indicating the market has not yet moved into the euphoric positioning that precedes sharp corrections.
Technical and Fundamental Influences
Price has been forming higher lows since the February trough, transitioning from correction into a structured recovery channel. The current candle has cleared the 38.2% Fibonacci retracement of the $104,000-to-$62,000 decline, calculated at $78,044, which now acts as immediate support. The next critical Fibonacci level is the 50% retracement at approximately $83,000, which converges directly with the 200-day EMA near $83,842, making the $83,000–$84,000 band the most technically significant zone on the chart. An additional resistance cluster at $80,000–$80,617 represents both today’s session high and a dealer gamma boundary that has previously capped momentum. A sustained close above $83,842 projects extension toward the 61.8% retracement at $87,956.
The RSI(14) at 64.81 leads its signal line at 61.24 by 3.57 points, confirming buying pressure without reaching the 70 overbought threshold. The MACD fast line at 1,675 clearing the signal at 1,672 has produced a fractionally positive histogram; the crossover is fresh and the bar depth is slim, so histogram expansion over the next two to three sessions is needed to validate the signal. Parabolic SAR and OBV remain bullish, and the ADX, though rising, sits below 25, consistent with a constructive but not yet strongly trending environment. From a Bollinger Band standpoint, price has advanced from the lower band at the February low through the midline and is approaching the upper band, suggesting momentum is building rather than exhausting.
Moving average structure is fully aligned on the short-to-intermediate timeframe. Price trades above the 5-day EMA, 20-day EMA, and 50-day SMA, all of which are sloping upward. The 100-day moving average, a former resistance level in April, has been reclaimed as support. The 200-day SMA near $77,380 sits inside the current trading range, while the 200-day EMA at $83,842 remains the outstanding barrier. Support below current price stacks at $78,044, then $75,000 where negative dealer gamma and significant options market activity amplify directional moves, and deeper at $74,000–$74,300 near the 50-day convergence zone.
The week’s fundamental agenda is anchored by two high-impact events. Strategy holds 818,334 BTC at an average cost of $75,537 and reports Q1 2026 earnings on May 5. Bitcoin’s more than 20% decline during Q1 generated an estimated $14.5 billion in unrealised losses, and markets will focus on whether the company resumed accumulation during April’s recovery and any forward guidance on purchasing intentions. Separately, Powell exits the Fed Chair role on May 15 with Kevin Warsh stepping in after clearing the Senate Banking Committee on April 29 in a 13-to-11 vote; full Senate confirmation is expected the week of May 11. Warsh will not chair an FOMC meeting until June, but his early statements carry significant weight. His record favours tighter real rates and balance sheet reduction, yet JP Morgan analysts expect him to cut rates faster than Powell, and Trump has publicly stated disappointment if June does not bring a reduction. The current fed funds rate stands at 3.5%–3.75% with one cut projected for the remainder of 2026. Every Fed chair transition since 2014 has historically been followed by a multi-month Bitcoin correction, though the $100 billion ETF infrastructure underpinning the current cycle represents a structural difference absent in prior episodes. Iran’s submission of a peace proposal on May 1 adds a geopolitical variable: resolution supports risk appetite broadly, while renewed escalation would generate macro risk-off pressure.
Looking Forward
Bitcoin’s most important test of the 2026 recovery arrives this week. The $80,000–$80,617 immediate resistance must be cleared on a closing basis before the $82,228 weekly structure and the $83,842 200-day EMA become realistic targets. A weekly close above $82,228 is broadly cited as the breakout confirmation level; if achieved, upside projections at $85,000–$87,956 become accessible on a one-to-three-week horizon. Polymarket data assigns approximately 40.5% odds to Bitcoin reaching $85,000 before month-end, and algorithmic forecast models place the weekly range between $79,530 and $84,358. To the downside, a failure to hold the $78,044 Fibonacci level refocuses attention on the $75,000–$75,537 zone, where dealer gamma dynamics and Strategy’s average cost basis converge into the cycle’s most structurally robust support floor. With the MACD histogram thin and RSI at 64.81 yet to test 70, the trend carries residual momentum; the near-term bias remains moderately constructive but hinges directly on the catalyst outcomes of the next five sessions.