Key Takeaways
- XAU/USD opened the week at $4,774, printing an intraday high of $4,814 and a low of $4,736 before settling near $4,793, a decline of 0.78% on the session.
- RSI(14) sits at 51.33 with its signal line at 49.38, reflecting neutral momentum following a violent round-trip from January’s all-time high at $5,595 to the mid-March trough near $4,090.
- Price trades above the 21-day SMA at $4,654 and the 100-day SMA at $4,721, but remains capped by the 50-day SMA at $4,894, the immediate battleground for bulls and bears.
- US-Iran tensions re-escalated over the weekend after a naval incident in the Strait of Hormuz, reviving competing safe-haven bids for both the dollar and gold simultaneously.
- Key macro releases this week include ADP employment data on Tuesday, initial jobless claims and flash PMIs on Thursday, and the University of Michigan inflation expectations report on Friday.
- Immediate resistance clusters at $4,860 to $4,894 (50-day SMA), with a breakout above $4,924 needed to open the path toward $5,045 and the downtrend line near $5,195.
- Near-term support holds at the reclaimed descending trendline near $4,775, with secondary levels at the 100-day SMA at $4,721 and the 21-day SMA at $4,654.
Market Dynamics and Recent Performance
Gold has delivered one of the most dramatic price arcs in recent memory. After surging to an all-time high of $5,595 on January 29, 2026, the metal spent the following six weeks in a steep corrective descent, carving out a trough near $4,090 by mid-March, a drawdown of roughly 27% from peak to trough. That correction reflected elevated US real yields, profit-taking from speculative longs who had fuelled a 65% gain across 2025, and a temporary reduction in geopolitical risk premium as early ceasefire discussions in the Middle East gained traction.
The recovery since that March low has been orderly and technically constructive. The pair has clawed back approximately $700, reclaiming the $4,500 and $4,650 zones before printing a weekly gain of 3.47% last week to close near $4,834. That rally was supported by a dollar index that failed to hold above key resistance at 101.14, and renewed institutional safe-haven positioning that carried XAU/USD back above both its 100-day and 21-day simple moving averages.
The tone entering this week shifted abruptly on Sunday when US-Iran tensions reignited over a naval blockade incident in the Strait of Hormuz, complicating the ceasefire set to expire on April 22. A significant portion of safe-haven demand rerouted into the dollar on Monday morning, explaining gold’s 0.78% intraday decline despite the escalating geopolitical backdrop. The market is now locked in a tug-of-war between gold and the greenback as competing havens, a dynamic likely to persist throughout the week. Structurally, central bank accumulation continues to anchor the price floor: 95% of surveyed central banks expect gold reserves to grow over the next twelve months, while the CME FedWatch probability of the Fed holding rates at 3.50% to 3.75% stands at 99.5%, capping the urgency for rate-driven gold selling.
Technical and Fundamental Influences
Monday’s session left a modest bearish candle (O $4,774 / H $4,814 / L $4,736 / C $4,793) within the recovery channel, with a lower wick at $4,736 testing the former descending resistance line that has now flipped to support near $4,775. The contained candle body suggests indecision rather than reversal. The moving average complex is constructive: price holds above the 21-day SMA at $4,654, the 100-day SMA at $4,721, and the structural 200-day SMA at $4,223, while the 50-day SMA at $4,894 acts as the ceiling. A daily close above $4,894 would shift the intermediate bias firmly bullish and expose $4,924, the level the World Gold Council identifies as clearing the way toward $5,045 and the ATH downtrend line near $5,195.
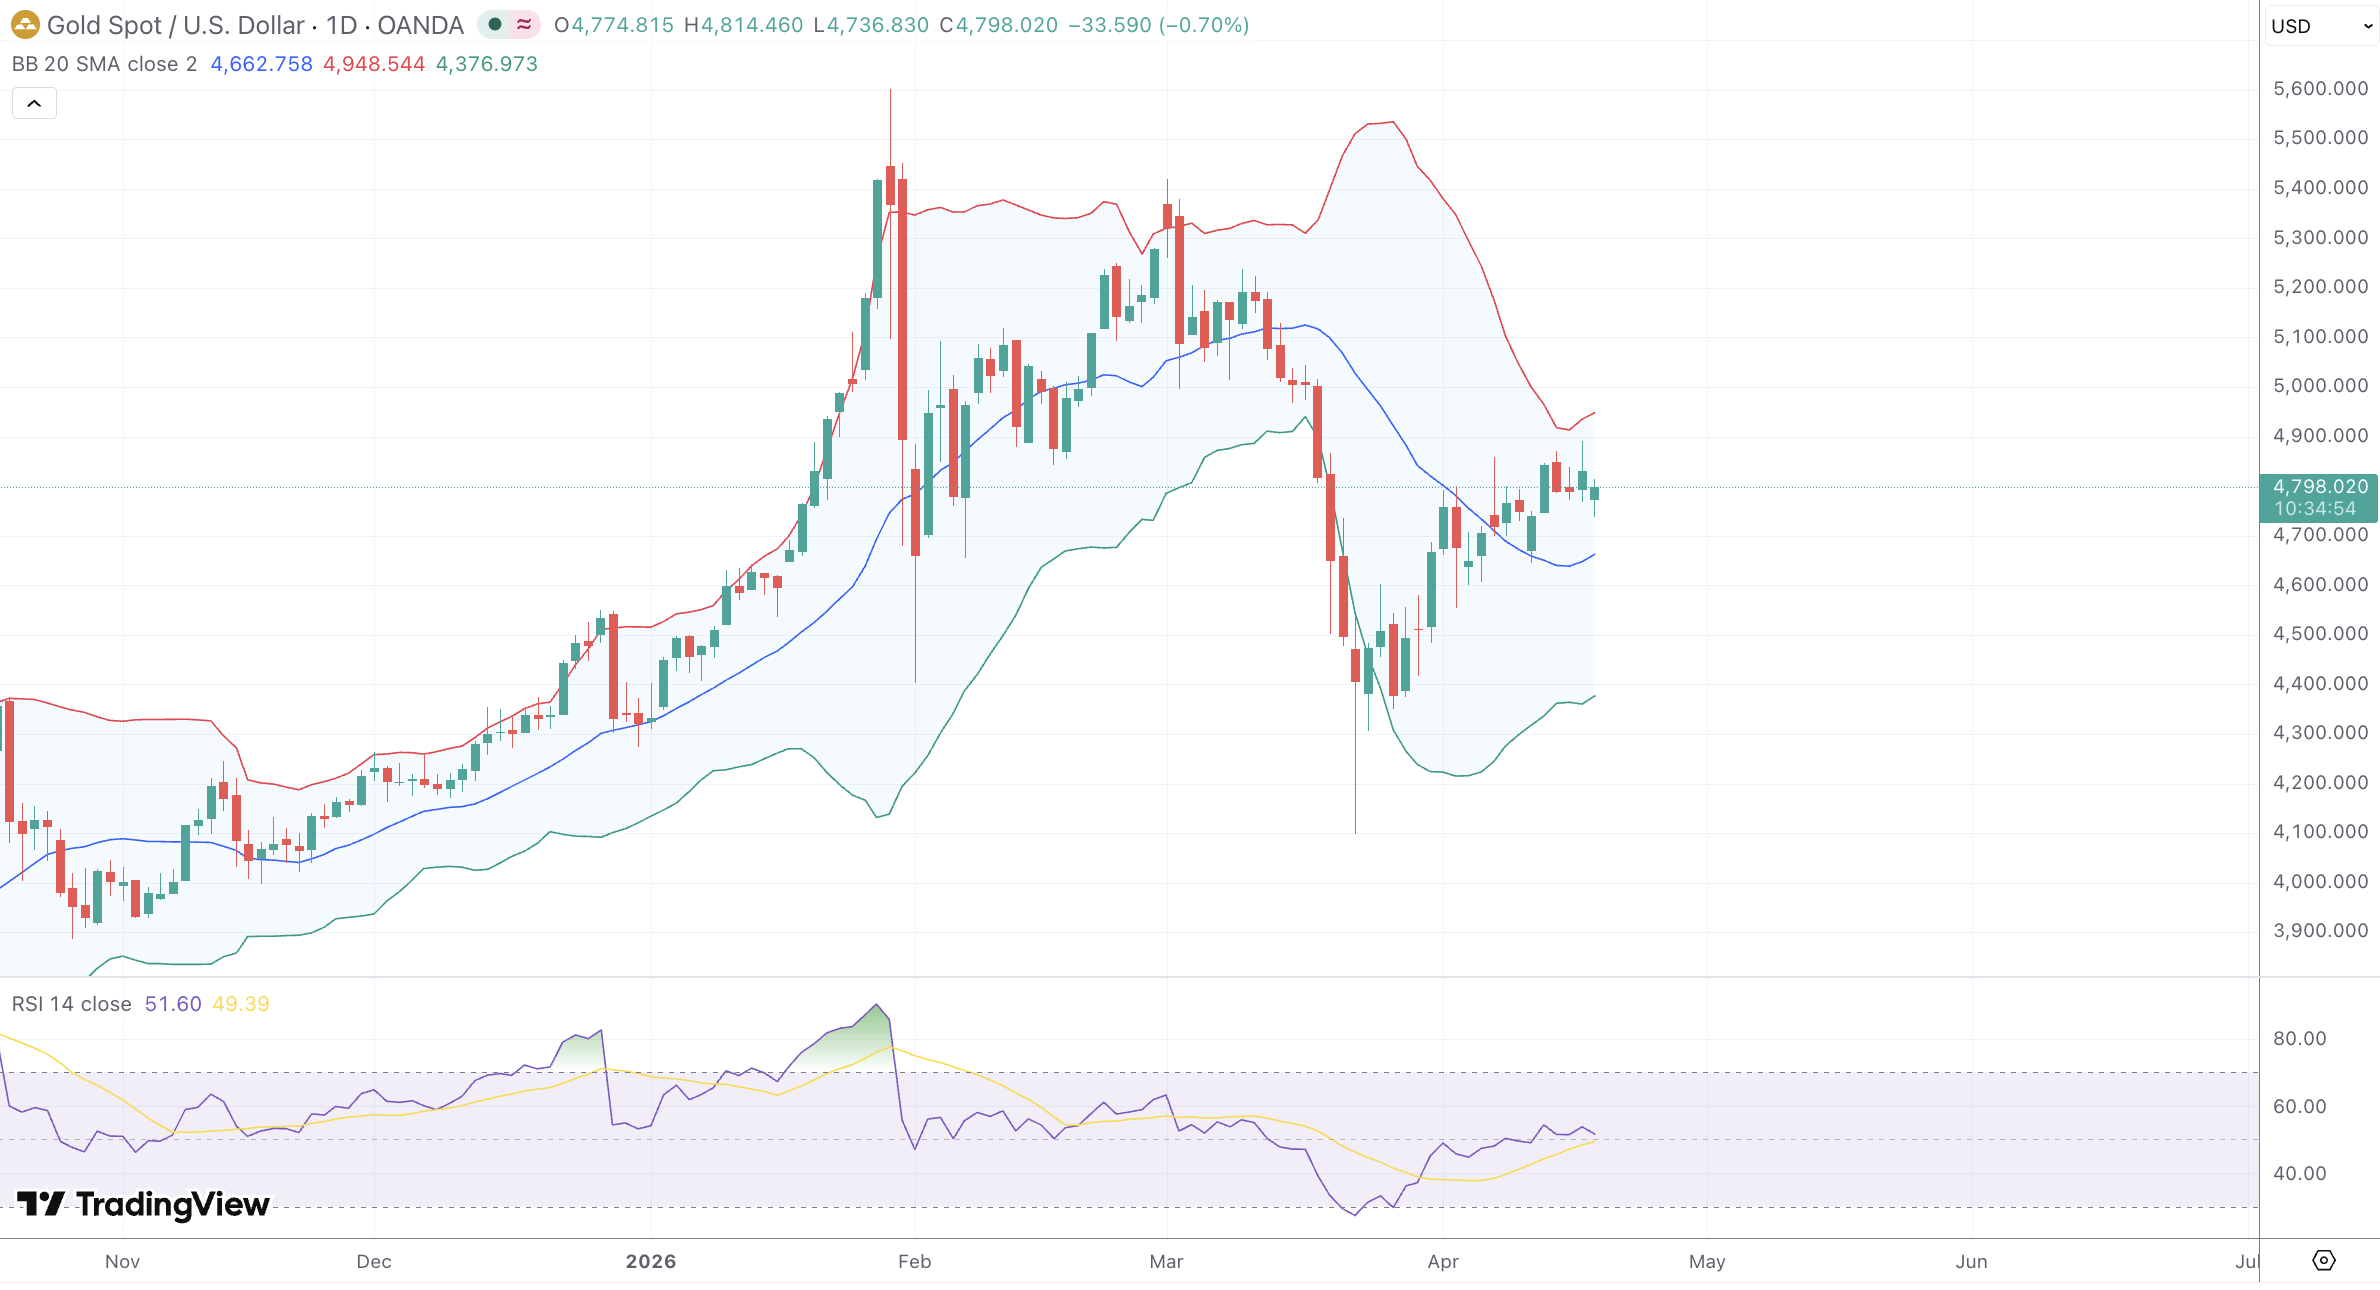
RSI(14) at 51.33 sits marginally above the neutral threshold, with its signal line at 49.38 producing a mild bullish crossover. The 1.95-point spread is insufficient to confirm strong upside momentum, but this configuration is typical of early-stage recovery consolidation building from deeply oversold March conditions. MACD crossed bullish in mid-April with the histogram in positive territory, though bars are not yet widening aggressively. A sustained break above the 50-day SMA would likely accelerate histogram expansion and confirm the recovery has matured beyond a corrective bounce.
Fibonacci analysis provides precise structural anchors. The 38.2% retracement of the full 2022-to-2025 uptrend near $4,075 converged with the March low and the long-term 200-day average at $4,174, confirming that zone as a major demand area. To the upside, the 61.8% retracement of the January-to-March decline projects toward $4,950 to $5,000, aligning with the psychological round number and institutional target consensus. Parabolic SAR remains in bullish mode with dots below price near $4,680 to $4,700. ADX has risen above 20 with +DI above -DI, indicating the trend is gaining directional conviction.
Bollinger Bands are contracting toward the midline after the March expansion, flagging an impending volatility breakout. OBV shows steady accumulation since the March trough, with recovery-session volume consistently outpacing retracement-session volume, supporting the thesis that institutional buyers are absorbing supply.
Thursday’s flash PMIs will be scrutinised for evidence that tariff disruptions are filtering into real economic activity, with any manufacturing deterioration reinforcing gold’s recession hedge appeal. The University of Michigan inflation expectations reading on Friday carries additional weight, with elevated prints likely to reignite the push toward the $4,924 to $5,045 resistance cluster. Trump’s ongoing challenges to Federal Reserve independence remain a persistent dollar-debasement narrative underpinning gold’s structural bid.
Looking Forward
The week of April 21 positions gold at a critical juncture. The $4,775 support zone is the nearest technical battleground: a sustained hold keeps the recovery intact and targets $4,860 to $4,894, while a break lower would expose the 100-day SMA at $4,721 and the 21-day SMA at $4,654 without compromising the broader structural uptrend. The Iran ceasefire expiry on April 22 is the most immediate binary risk, with escalation intensifying gold-dollar safe-haven competition and de-escalation potentially unwinding dollar bids faster than gold’s, clearing the path toward the 50-day SMA.
Over the medium term, the institutional consensus remains asymmetrically bullish. JPMorgan and Goldman Sachs maintain price ranges encompassing $5,000 and beyond, while UBS has raised its mid-2026 target to $6,200. The World Gold Council assigns a 30% probability to a $5,000 print if central bank demand and ETF inflows hold near 2025 pace. Traders should treat $4,775 as the downside line of near-term significance, and a clean daily close above the 50-day SMA at $4,894 as the trigger that validates a renewed advance toward $5,000 and the broader downtrend resistance near $5,195.