Key Takeaways
- Bitcoin trades at $77,671 following a 1.26% session pullback, with the daily candle printing an $78,666 open, $79,490 high, and $77,492 low.
- US spot Bitcoin ETFs absorbed roughly $2.43 billion in April inflows, the strongest monthly haul of 2026 and ending a four-month outflow streak.
- RSI 14 reads 61.03 with the signal line at 62.60, while MACD prints 2,040 over a 1,873 signal with a positive but compressing histogram of 168.
- The April 28-29 FOMC meeting and Powell’s term expiration on May 15 stand as the dominant macro catalysts of the week.
- Immediate resistance sits at $79,500 then $82,000, while layered support runs through $76,000, $74,500, and the structural floor near $70,000.
Market Dynamics and Recent Performance
Bitcoin enters the final trading week of April consolidating just under $80,000 after a relentless six-week recovery that lifted spot from sub-$60,000 February lows to a fresh four-month high of $79,490 in Monday’s session. The rejection from that level, which produced a 989-point retracement back to $77,671, was orderly rather than impulsive, with intraday volume profile suggesting profit-taking from short-term holders rather than aggressive distribution from larger cohorts. The 1.26% daily decline leaves the asset roughly 28% above its February 5 capitulation print near $60,000 and approximately 38% below the $126,021 all-time high registered in October 2025.
The structural backdrop has shifted meaningfully over the past two weeks. Spot Bitcoin ETFs have logged eight consecutive sessions of net inflows, accumulating roughly $2.43 billion through April and registering their best monthly performance since the late September to early October 2025 streak. BlackRock’s iShares Bitcoin Trust has remained the dominant vehicle, attracting single-session prints as large as $284 million and pulling year-to-date flows back into positive territory near $245 million after Q1 saw outflows above $4 billion. Morgan Stanley’s MSBT product opened with a $30 million first-day intake, while Strategy disclosed its third-largest historical Bitcoin purchase last week, reinforcing the institutional accumulation narrative. Cumulative spot ETF assets under management have climbed back above $96.5 billion, the highest level since mid-March.
Sentiment has lifted from outright fear into cautious optimism. The Crypto Fear and Greed Index reads 46, a neutral print that contrasts sharply with the sub-25 readings recorded during February’s flush. CME Bitcoin futures open interest has expanded alongside spot, although funding rates across major perpetual venues remain modestly positive rather than overheated, suggesting the rally retains room to extend before becoming structurally overcrowded. CryptoQuant data continues to flag elevated long-term holder exchange inflows, an indication that older coins are being distributed directly into the institutional bid rather than triggering a coordinated supply shock.
Technical and Fundamental Influences
The daily chart presents a constructive but maturing recovery structure. Price action has cleared the descending channel that capped Bitcoin between January and March, broken decisively above the 50-day SMA near $69,700, and reclaimed the 100-day SMA at $74,900 as new dynamic support. The 20-day EMA at $74,400 provides a second tactical floor, while the 200-day SMA at approximately $87,300 looms as the next major hurdle for any sustained breakout. The 5-day and 50-day EMA stack remains positively inclined and supportive of near-term continuation, although the 200-day remains in negative slope, reflecting the wider bearish damage absorbed earlier in the year.
Momentum indicators paint a nuanced picture. RSI 14 sits at 61.03 with its signal line just above at 62.60, marking a fresh bearish cross within bullish territory and signalling that upside momentum has cooled relative to the prior week’s peak readings near 65. The structure remains constructive while RSI holds above 50, but a break below would warn of a deeper retracement toward the moving average cluster. MACD remains in positive territory with the line at 2,040 against a signal of 1,873, with the histogram at 168 still printing above zero but compressing, an early divergence that often precedes consolidation rather than outright reversal. Parabolic SAR dots remain below price on the daily, ADX hovers near 22 indicating moderate but not yet strongly trending conditions, and ATR readings near 2,800 reflect a notable contraction in realized volatility from February’s peak above 5,500. Bollinger Bands have begun to widen on the upside test, with the upper band sitting near $80,500 and the midline at $74,000, while OBV has steadily climbed alongside price, confirming accumulation rather than divergence.
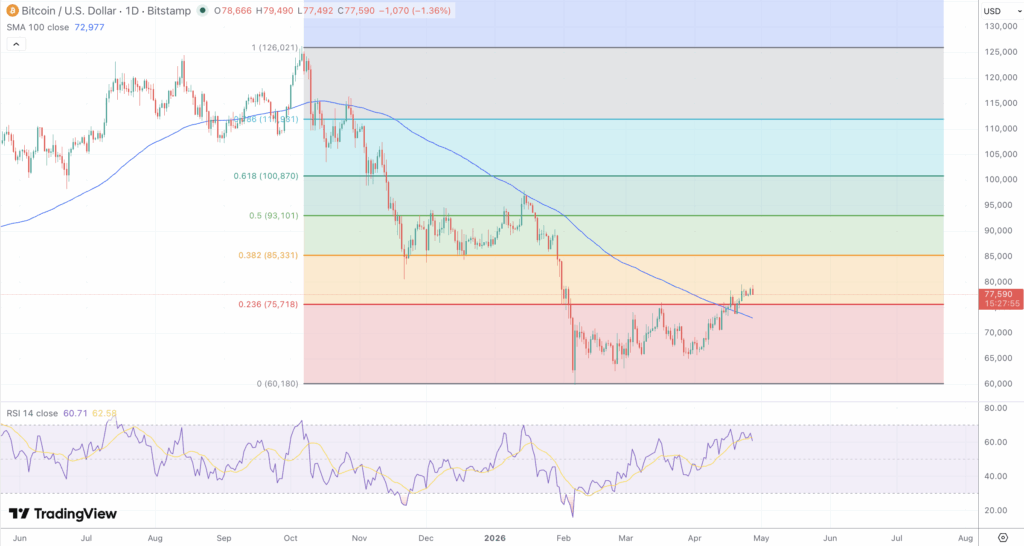
Fibonacci structure remains central to the week’s risk management. Measuring the major swing from the $126,021 October high to the $60,180 February low, the 23.6% retracement at $75,750 is now functioning as immediate support, while the 38.2% level at $85,330 aligns with the broader resistance cluster near $85,000 to $87,000 that includes the 200-day SMA. The 50% midpoint of the same swing sits at $93,100 and represents the key psychological gateway for any sustained push back toward six figures. On the shorter swing from the late March low near $64,800 to Monday’s $79,490 high, the 38.2% retracement at $73,880 and the 50% retracement at $72,150 provide layered downside cushions should this week bring a deeper consolidation.
The fundamental calendar is dense. The Federal Reserve concludes its two-day FOMC meeting on April 29 with policy widely expected to remain on hold at the 3.50% to 3.75% target range, marking the third consecutive pause since the December 2025 cut. Markets are pricing roughly a 98% probability of no change at this meeting, placing Powell’s press conference and the language around inflation, labor market risks, and the Iran-related energy shock at the heart of price discovery for risk assets. Powell’s chairmanship expires May 15, and the eventual successor pick will reshape the rate-cut calculus heading into the second half. Beyond the Fed, the SEC’s CLARITY Act roundtable continues to feed institutional confidence in regulatory clarity, while ongoing Middle East ceasefire discussions have triggered the risk-on rotation powering the recent ETF bid.
Looking Forward
The path of least resistance into the FOMC release favors bulls so long as Bitcoin defends the $76,000 to $76,500 support shelf, a zone reinforced by the prior breakout pivot and converging short-term moving averages. A clean daily close above $79,500 would unlock a measured move toward the $82,000 to $82,500 resistance band, with the $85,000 to $87,000 cluster, encompassing the 38.2% Fibonacci of the major swing and the 200-day SMA, standing as the gatekeeper to any renewed challenge of the six-figure psychological level. ETF flow data will likely dictate the pace, with sustained daily intakes above $200 million continuing to absorb long-term holder distribution and anchor dips.
To the downside, a daily close below $76,000 would expose the $74,000 to $74,500 zone where the 100-day SMA, 20-day EMA, and the 23.6% Fibonacci of the major swing converge. A deeper flush toward $70,000 cannot be ruled out if Powell strikes a more hawkish tone than markets expect or if ETF flows reverse abruptly into month-end. The structural backstop remains the $65,000 to $68,000 February consolidation base, the loss of which would invalidate the recovery thesis and reopen risk toward $60,000.
For the week ahead, the bullish base case targets $80,000 to $82,000 on a successful FOMC pass and continued ETF accumulation, while the bearish alternative sees a retracement toward $74,000 to $75,000 if Powell pushes back against rate-cut expectations or if profit-taking accelerates near the $80,000 round number. With realized volatility compressed and positioning relatively balanced, traders should expect an asymmetric reaction to Wednesday’s policy statement and brace for an expanded daily range through the final two sessions of the week.