
Key Takeaways
- EUR/USD is consolidating around 1.1720 after a steady recovery from the early-March cycle low at 1.1408, currently boxed between the 50% Fibonacci ceiling at 1.1745 and structural support near 1.1665.
- The European Central Bank held rates steady on May 1, but Christine Lagarde confirmed a hike was actively debated, with money markets now pricing roughly 75 basis points of tightening by year-end and three full quarter-point hikes priced into 2026.
- Eurozone April CPI rose to 3.0% (the highest since September 2023), while Q1 GDP expanded a meager 0.1%, raising stagflation concerns amid Brent crude near four-year highs.
- Friday’s US Non-Farm Payrolls (consensus 73K versus 178K prior, unemployment seen at 4.3%) and Tuesday’s ISM Services PMI are the dominant catalysts for the week.
- RSI(14) at 53.70 has crossed below its signal at 56.05, while the MACD histogram has flipped marginally negative at -0.00045, hinting at fading bullish momentum.
Market Dynamics and Recent Performance
The euro enters the first full trading week of May just above the 1.1720 handle, with daily action confined to a narrow 1.1711 to 1.1747 corridor. The pair has staged a textbook recovery from the early-March capitulation low at 1.1408, tracing a higher-low structure through April that culminated in a swing high near 1.1855 around the 17th. That advance produced roughly 450 pips of upside in just over six weeks, but the rally has visibly stalled in the upper third of the broader 1.14 to 1.21 range that has defined trading since November.
April’s monthly gain of just over 1% masked a story of two halves. The first two weeks were marked by an aggressive risk-on bid, with the pair gaining nearly 200 pips in days as the Iranian ceasefire sparked a violent unwind of dollar safe-haven flows. EUR/USD ripped from the 1.1525 area to north of 1.1685 in a single session on April 7. Since the 1.1855 peak, however, momentum has cooled noticeably as the ceasefire has frayed, oil has marched higher, and traders have begun questioning whether the Eurozone can absorb another energy shock without slipping into stagflation.
Friday’s tape exemplified the indecision now gripping the pair. EUR/USD opened at 1.17452, tested 1.17474, slipped to 1.17112, and settled essentially flat at 1.17207. The compressed 36-pip range reflects the standoff between a hawkish-leaning ECB and a resilient dollar bid, with three consecutive small-bodied candles forming a textbook indecision pattern that typically precedes a volatility expansion.
Technical and Fundamental Influences
The technical structure on the daily chart is finely balanced. Price is wedged between rising medium-term moving averages that have shifted from resistance to support during the April rally, and a descending resistance trendline projecting from the 1.2080 cycle high through the 1.1938 secondary swing high. The 200-day moving average, which capped advances throughout February and March, was reclaimed in April and now functions as the pivotal long-term reference beneath current price. The 50-day SMA has flattened just below the consolidation zone, while the 5-day and 21-day EMAs are converging in the 1.1710 to 1.1740 area. The 100-day SMA cluster sits in the same vicinity as the 200-day, creating a dense support shelf around 1.1665 to 1.1690 that has held firm during recent pullbacks.
Fibonacci analysis of the swing from the January peak at 1.2080 to the early-March cycle low at 1.1408 maps the immediate landscape. The 23.6% retracement at 1.1567 is the first major support if the consolidation fails. The 38.2% retracement at 1.1665 has been defended on each pullback through April and early May, stacking on top of the 200-day SMA. The 50% retracement at 1.1745 is the immediate ceiling and matches Friday’s high almost to the pip, while the 61.8% golden ratio at 1.1823 coincides with the descending trendline from the January peak, representing the make-or-break level for any sustained recovery toward the 1.1938 yearly pivot and the 1.2080 cycle high.
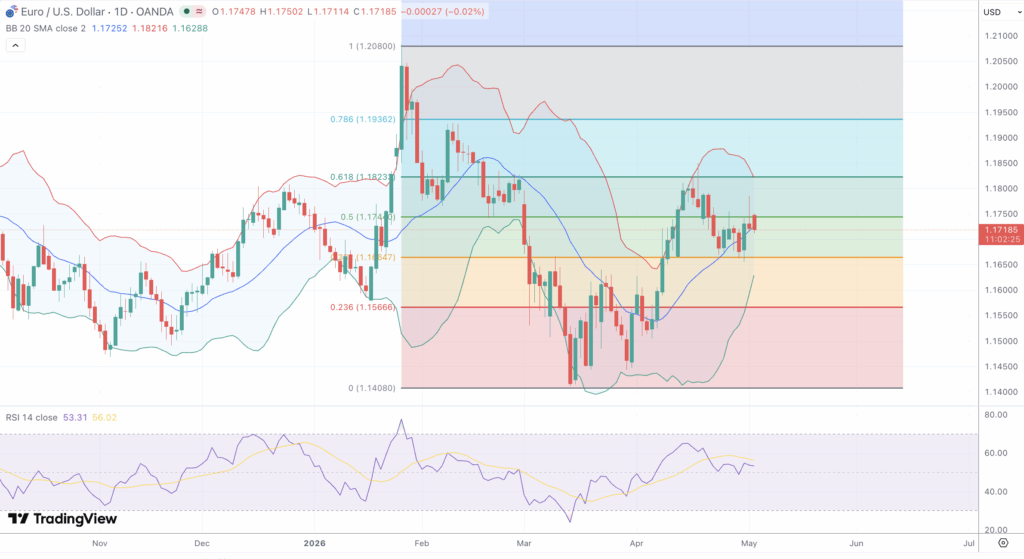
Momentum readings confirm the loss of upside thrust. RSI(14) prints at 53.70 against its signal at 56.05, a recent bearish crossover that leaves the oscillator sloping lower from levels that briefly approached the overbought threshold during the April rally. MACD on the (12, 26, 9) setting shows the histogram flipping marginally negative at -0.00045 even as both the MACD line at 0.00210 and the signal at 0.00255 remain above the zero line, a classic warning of a slowing uptrend rather than an outright reversal. Shrinking real bodies and prominent upper wicks at the 1.1855, 1.1830, and 1.1810 highs hint at distribution near range extremes. Bollinger Band width has contracted noticeably, ATR readings have compressed well below year-to-date averages, and ADX has declined into the high teens, confirming a trendless regime that historically precedes a sharp expansion in volatility. Parabolic SAR sits just above price and OBV is plateauing in line with the flat tape.
The fundamental backdrop is unusually rich. The ECB held its main refinancing rate unchanged on May 1, but Lagarde delivered a hawkish press conference, confirming that a hike had been actively debated and that policymakers are openly moving away from their baseline scenario. Hawks Joachim Nagel and Madis Müller have since flagged the possibility of tightening as soon as June, citing Eurozone CPI at 3.0% in April (a full 100 basis points above the 2% target) and persistent oil-driven inflation pressures. Money markets now price roughly 75 basis points of cumulative ECB hikes by year-end, with three quarter-point moves fully priced into 2026 and the first hike priced for July. Against that, Eurozone Q1 GDP expanded just 0.1%, raising legitimate questions about whether the central bank is being forced to tighten into a stagflationary backdrop.
On the dollar side, the Federal Reserve held its policy band unchanged at 3.50% to 3.75% in late April, but the meeting produced four dissents, the highest count since October 1992, with three of those officials opposing the committee’s signal of eventual rate cuts. The hawkish tilt has lifted the 2-year yield close to 4.00% and pushed the 10-year above 4.40%. Brent crude near four-year highs on the continued naval blockade of Iranian ports remains the single most important variable for the pair, amplifying Eurozone import vulnerability while reinforcing the dollar’s safe-haven and petrodollar status. Reported Japanese intervention in USD/JPY weighed on the broader dollar complex last week, while US Q1 GDP came in at 2.0% versus 2.3% expected, taking some immediate steam out of the dollar without shifting the structural narrative.
Looking Forward
The week ahead is loaded with USD-centric catalysts that should resolve the current 1.1700 to 1.1750 standoff. Tuesday’s ISM Services PMI carries outsized weight given the employment sub-component’s status as a leading indicator for Friday’s NFP. Wednesday’s ADP, Thursday’s Initial Jobless Claims, and Friday’s payrolls form a four-day labor sequence that will define dollar direction. Consensus expects April NFP at 73K from 178K prior, with unemployment at 4.3%. A meaningfully softer print, anything below 50K, would likely propel EUR/USD through 1.1745 toward the 1.1823 confluence, while a beat above 100K would test the 1.1665 to 1.1685 demand pocket and risk a deeper retracement toward 1.1567.
Eurozone data flow is lighter but still consequential. Final S&P Global PMI revisions arrive Monday, followed by retail sales, producer prices, and factory orders mid-week. ECB speakers including Lagarde, Nagel, and Müller are scheduled across the week, and any reinforcement of the June-hike narrative would tighten the rate-differential support beneath the euro. Iran and Strait of Hormuz headlines remain the wildcard, with de-escalation likely to weaken the dollar’s safe-haven bid and any renewed flare lifting Brent and reigniting the euro-negative stagflation trade.
The technical setup leans neutral with a marginal bearish tilt heading into the data deluge. Bulls need a daily close above 1.1745 to neutralize the recent loss of momentum and reopen the path toward 1.1823 and the 1.1855 April high. A weekly close above 1.1823 would unlock 1.1938 and the psychological 1.2000 handle, with the 1.2080 January peak as the ultimate target on a confirmed breakout. Conversely, sustained acceptance below 1.1700 brings the 200-day SMA cluster at 1.1675 into focus, and a decisive break of 1.1665 would reopen 1.1567 and potentially the 1.1408 cycle low. The compressed Bollinger Bands, depressed ATR, and falling ADX strongly suggest a breakout within days, and a sub-50K NFP combined with hawkish ECB rhetoric could easily drive a 150 to 200 pip range expansion before the week is out.